Opsly 1 / 22
Try it Exit tour

Source-available Read it, self-host it, contribute to it

Work management that scales with you

Opsly starts as a single person tracking their own to-dos and grows into a multi-team organization, all on infrastructure you control. Here's the tour.

Move with or the arrows below.

One tool, three sizes

Outgrow your to-do list, not your tooling

Most tools force a migration the moment you add a second person. Opsly's model is the same at every size. The surface area just grows with you.

01

Solo

Projects, tasks, priorities, and a scratch pad. Nothing to configure.

02

Team

Assignees, workflow stages, custom fields, dependencies, and notifications.

03

Organization

Per-role permissions, SLA tracking, audit trails, webhooks, and feature flags.

Dashboard

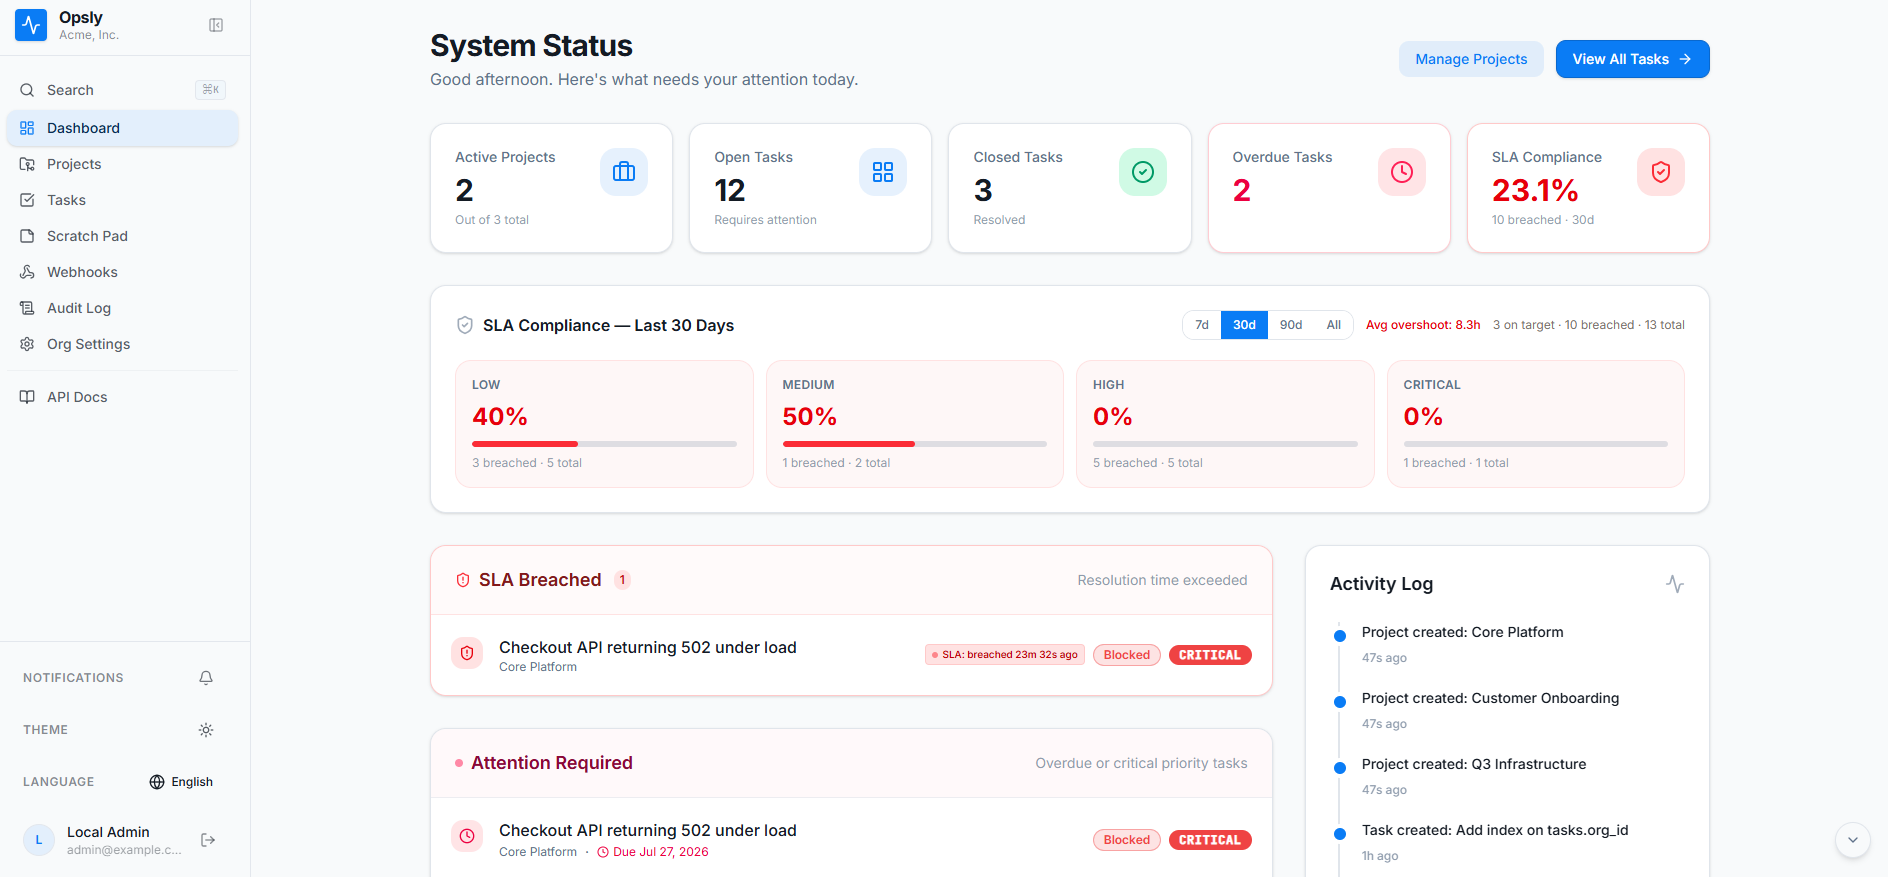
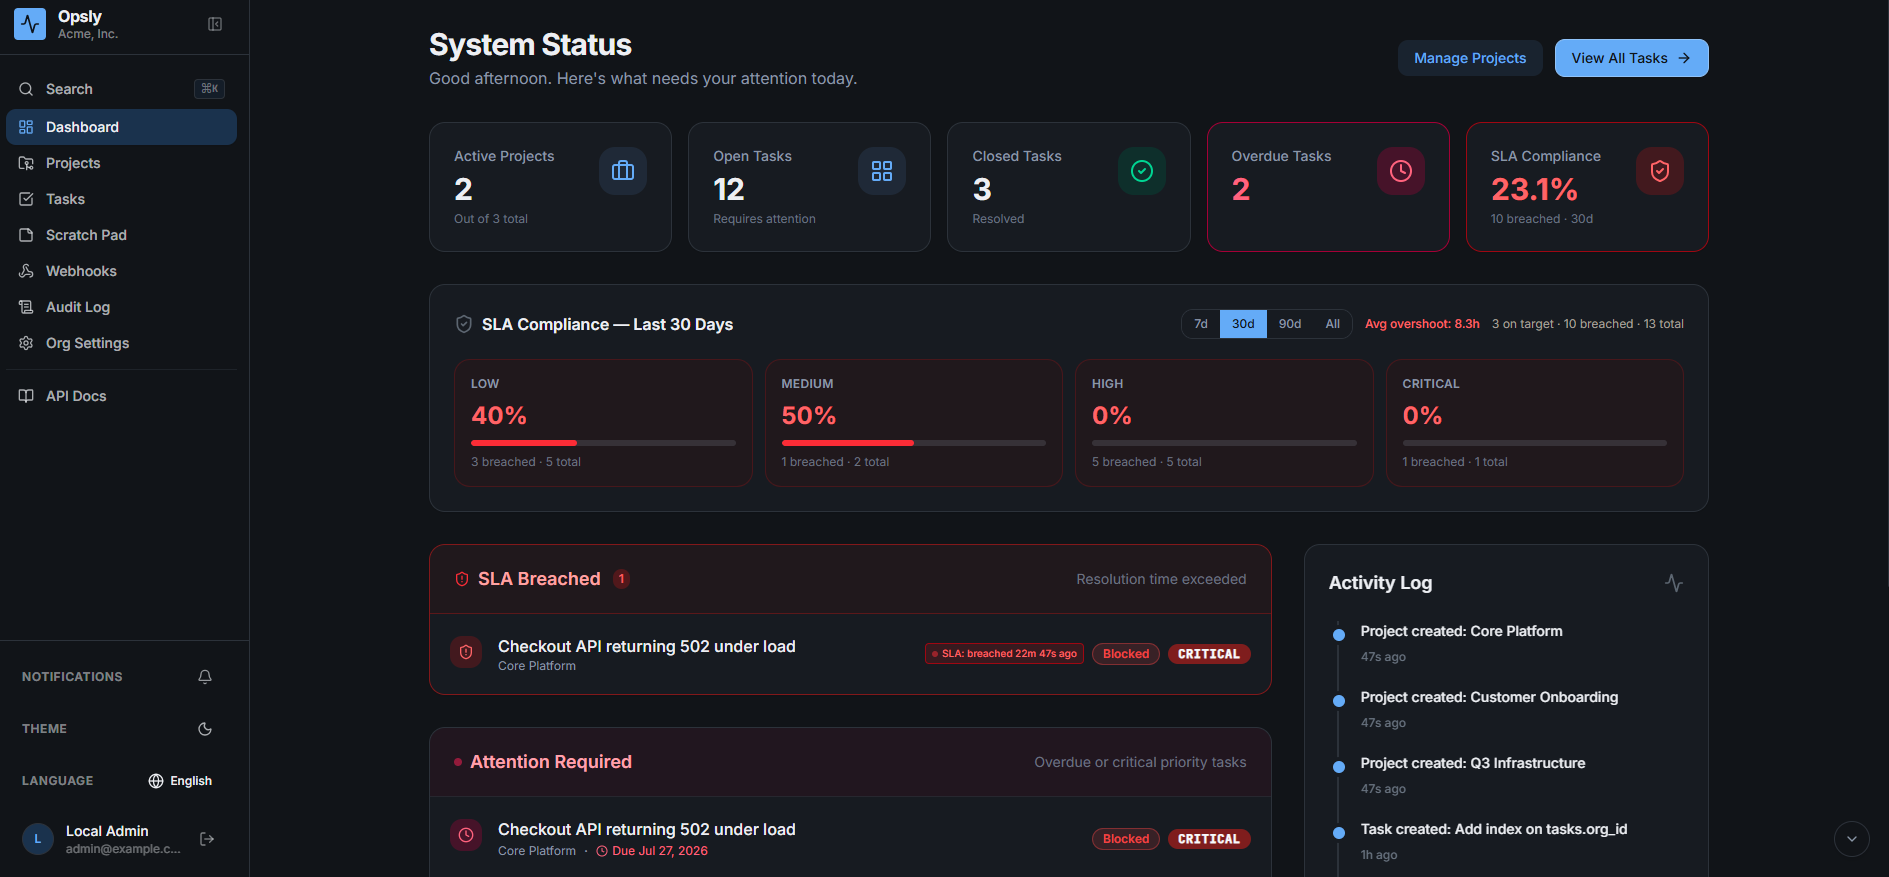
Where the day starts

Five counters across the top, then SLA compliance broken out per priority over a window you choose. Anything breached or overdue gets its own panel, and the activity log streams changes as they happen.

Opsly dashboard showing active projects, open, closed and overdue task counts, SLA compliance by priority, an SLA breached panel, attention required, and an activity log Opsly dashboard in dark mode showing active projects, open, closed and overdue task counts, SLA compliance by priority, an SLA breached panel, attention required, and an activity log

Projects

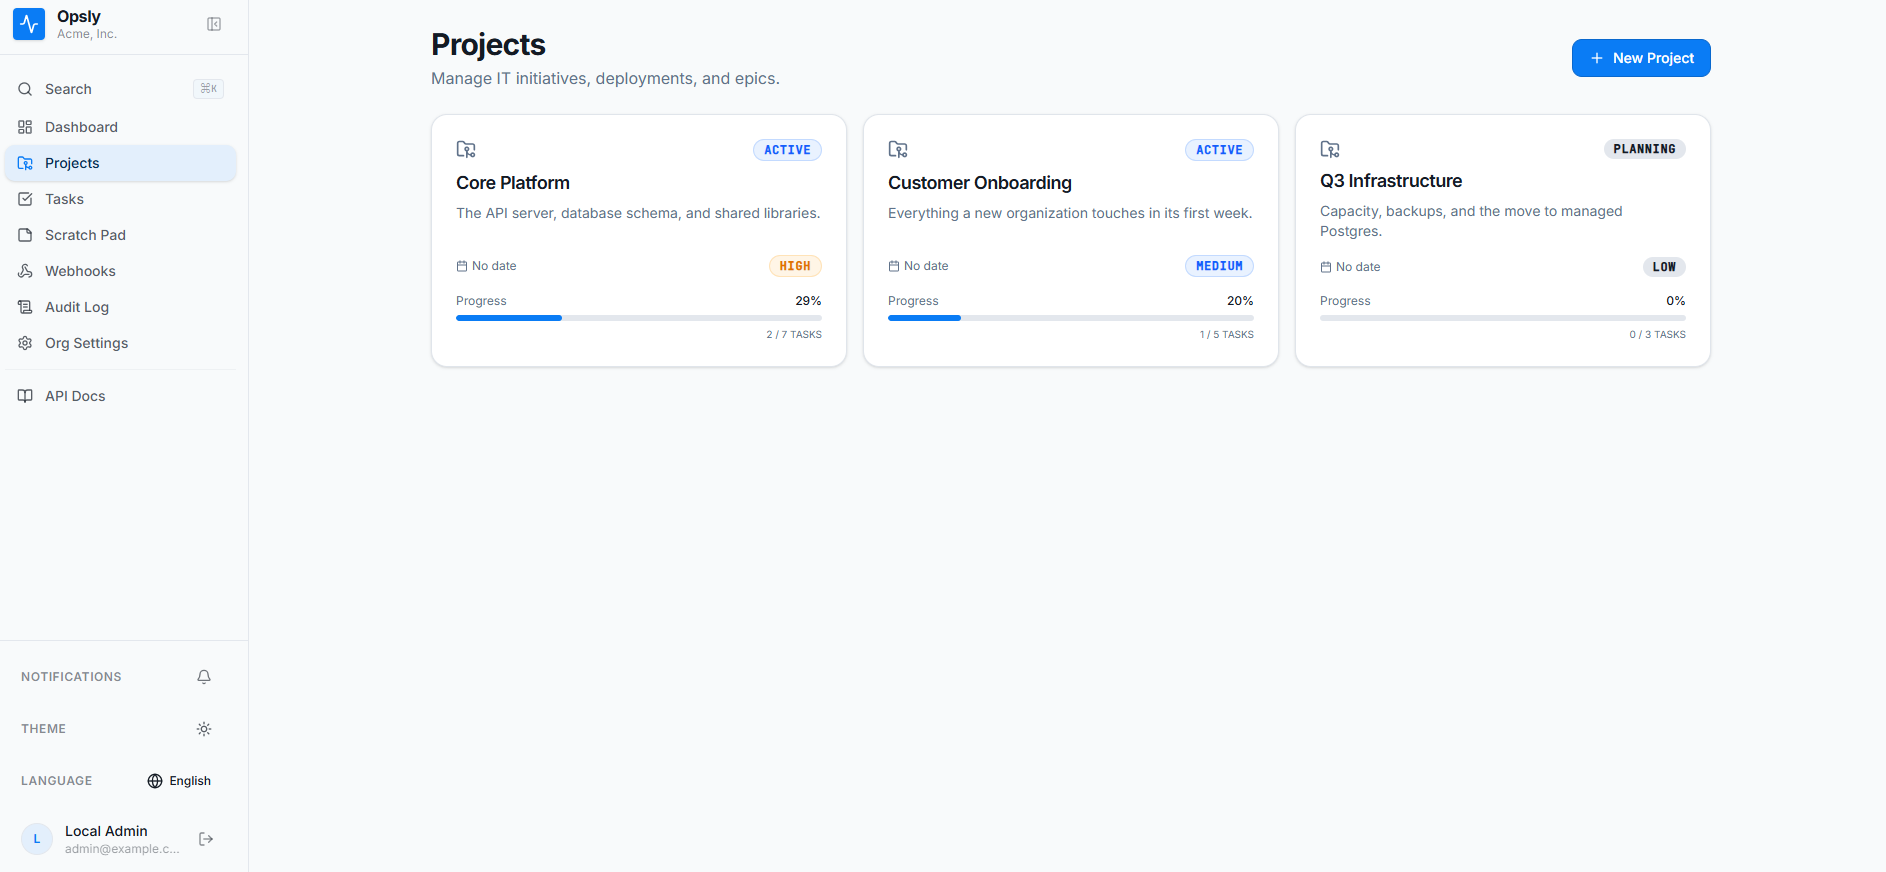
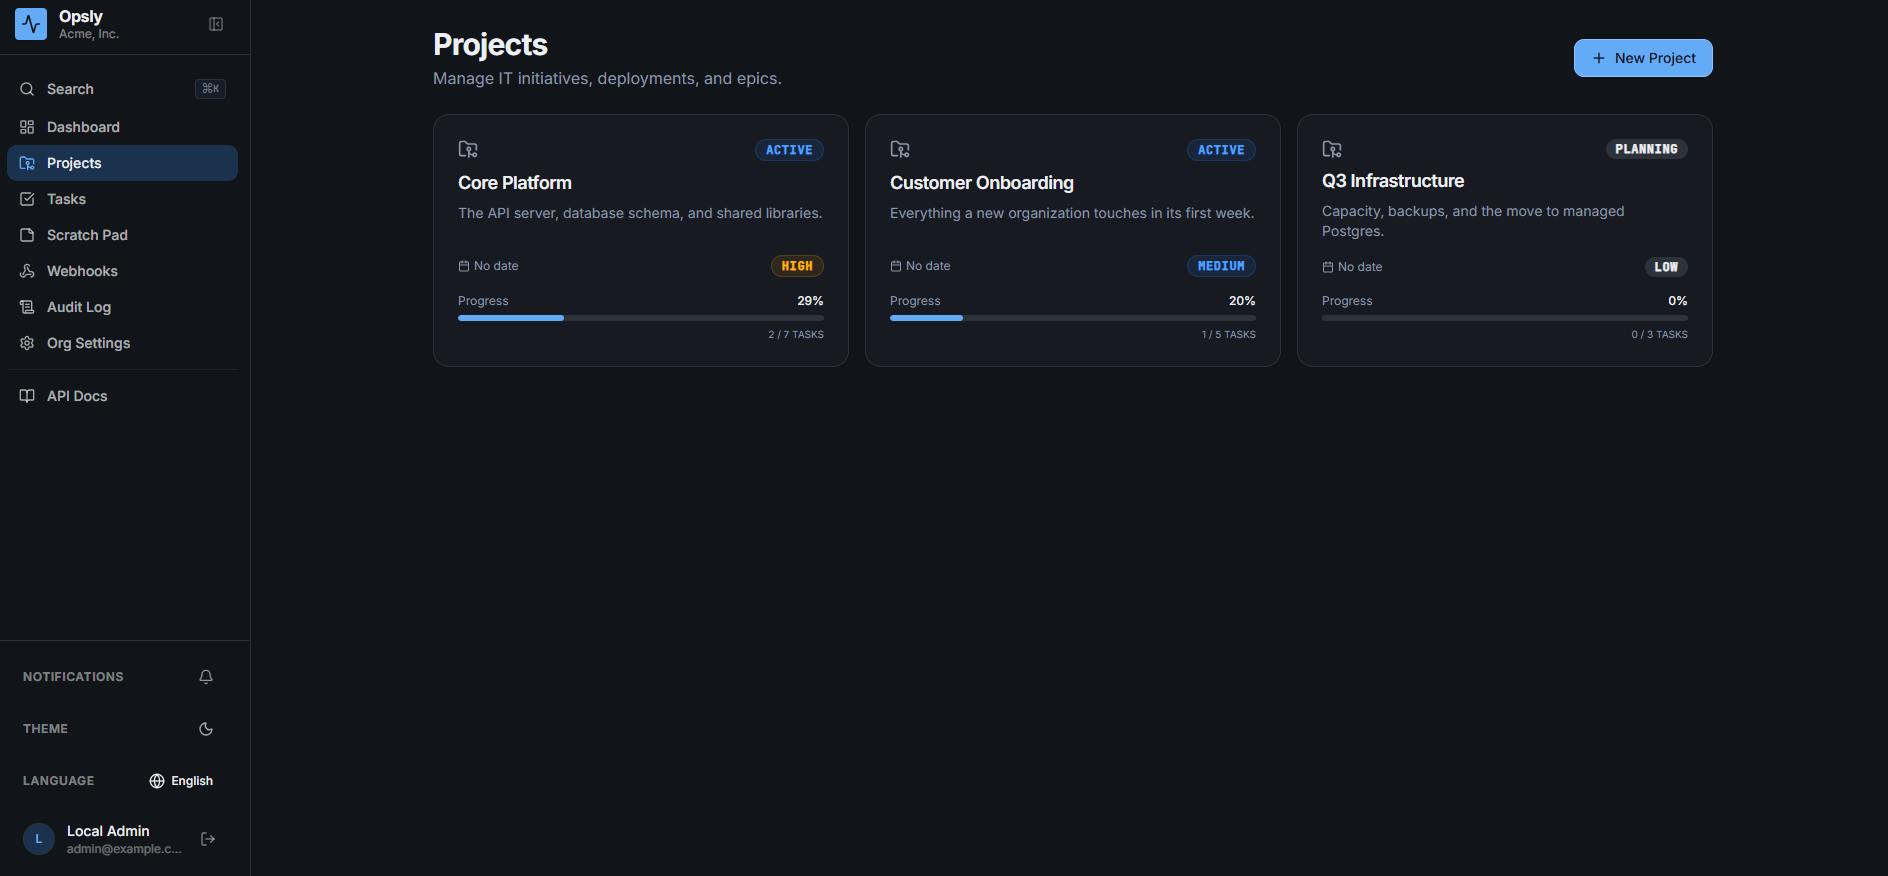
Work grouped the way you already group it

Each project carries its own status, priority, and completion percentage, so you can see which streams are moving without opening any of them.

Opsly projects page with cards for Core Platform, Customer Onboarding and Q3 Infrastructure, each showing status, priority and a progress bar Opsly projects page in dark mode with cards for Core Platform, Customer Onboarding and Q3 Infrastructure, each showing status, priority and a progress bar

Inside a project

Its own board, progress, and SLA policy

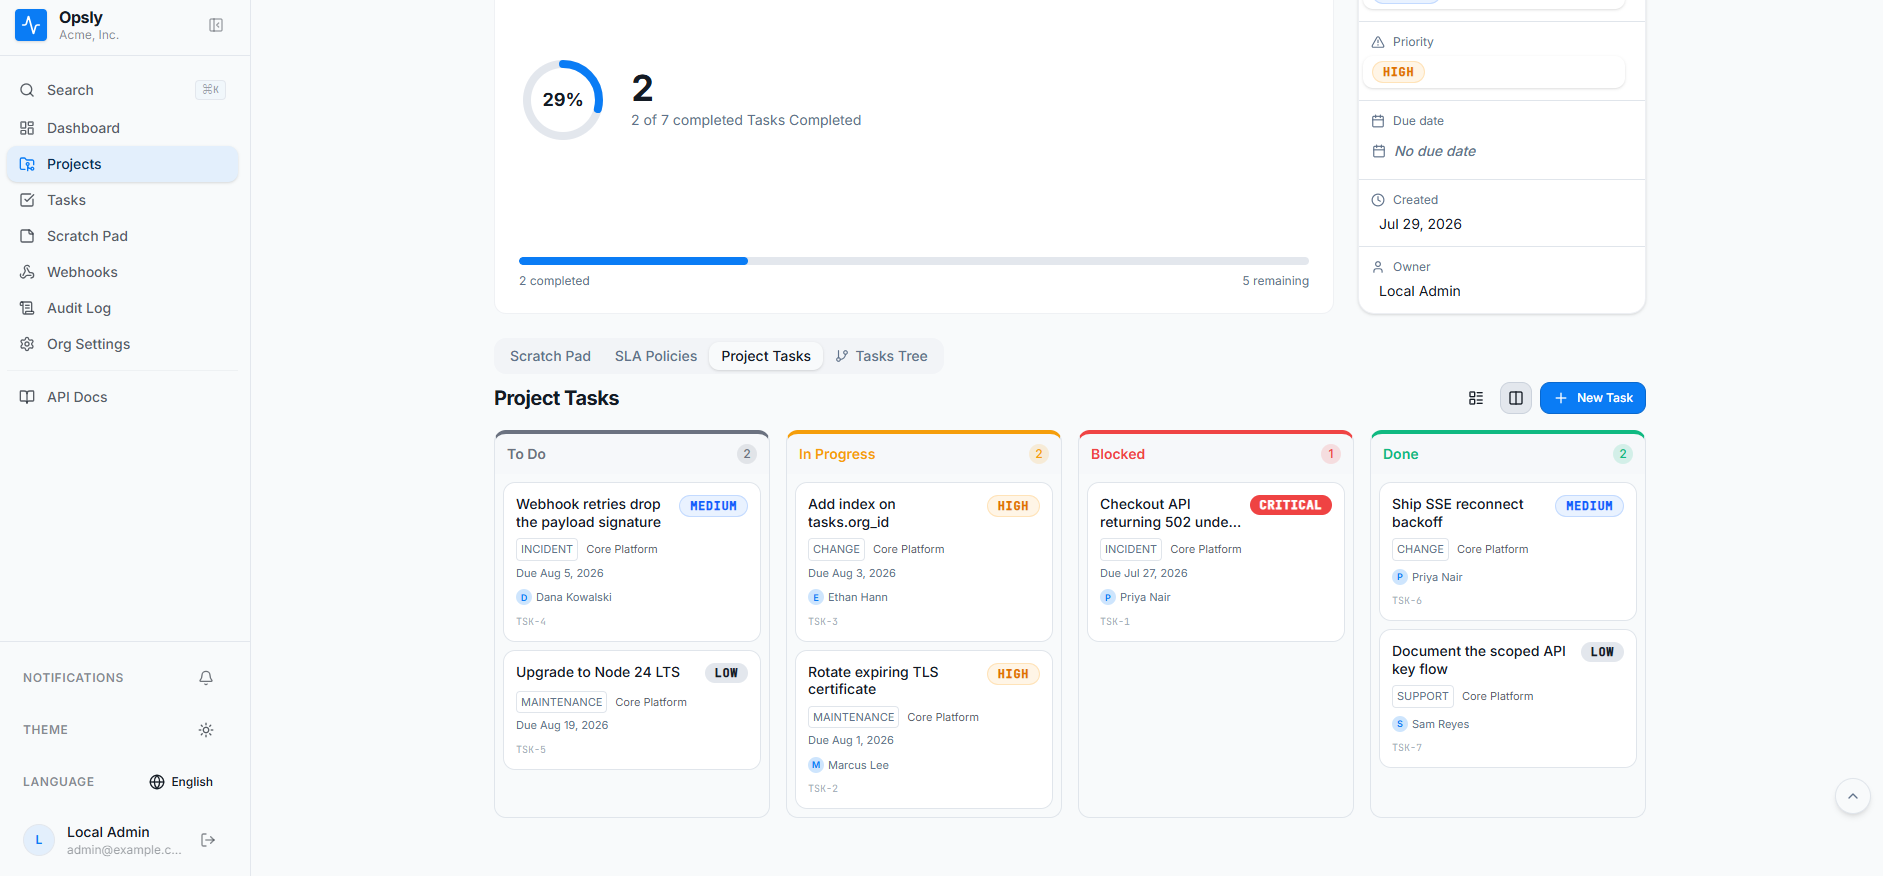
A project opens on its completion ring and a board scoped to just its work. The tabs alongside hold that project's scratch pad, SLA overrides, and dependency tree.

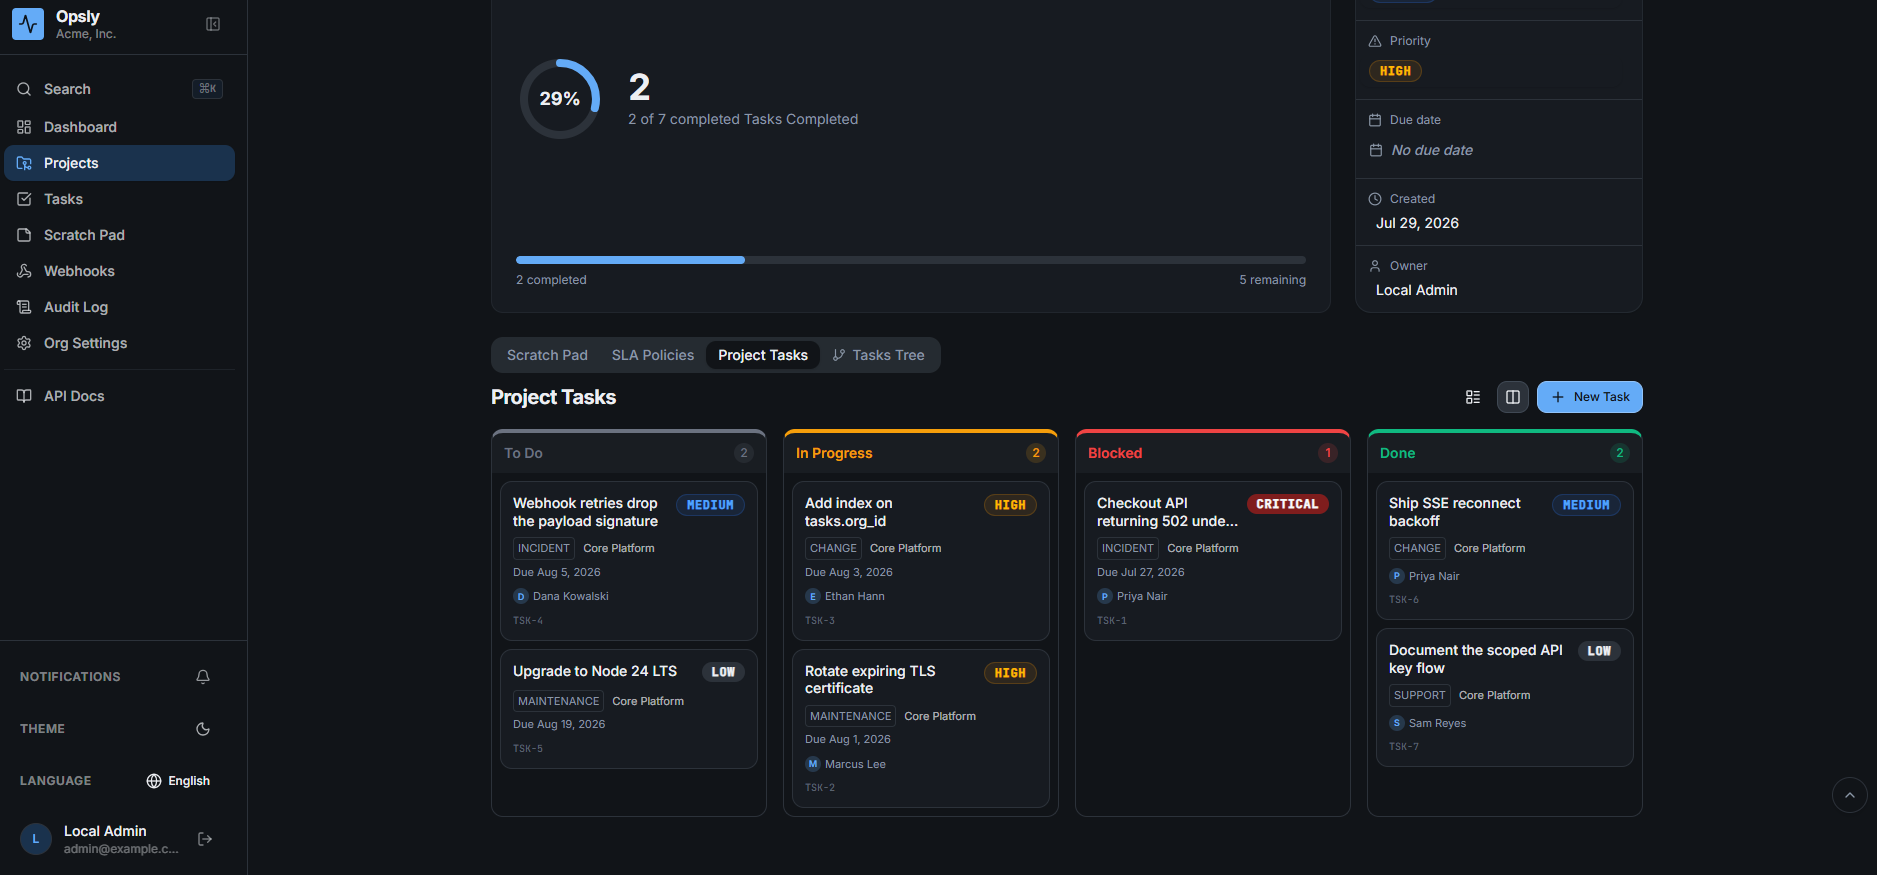
Opsly project detail page showing a 29 percent completion ring, two of seven tasks completed, and a Kanban board scoped to the project Opsly project detail page in dark mode showing a completion ring and a Kanban board scoped to the project

All tasks

Every board is a saved filter away

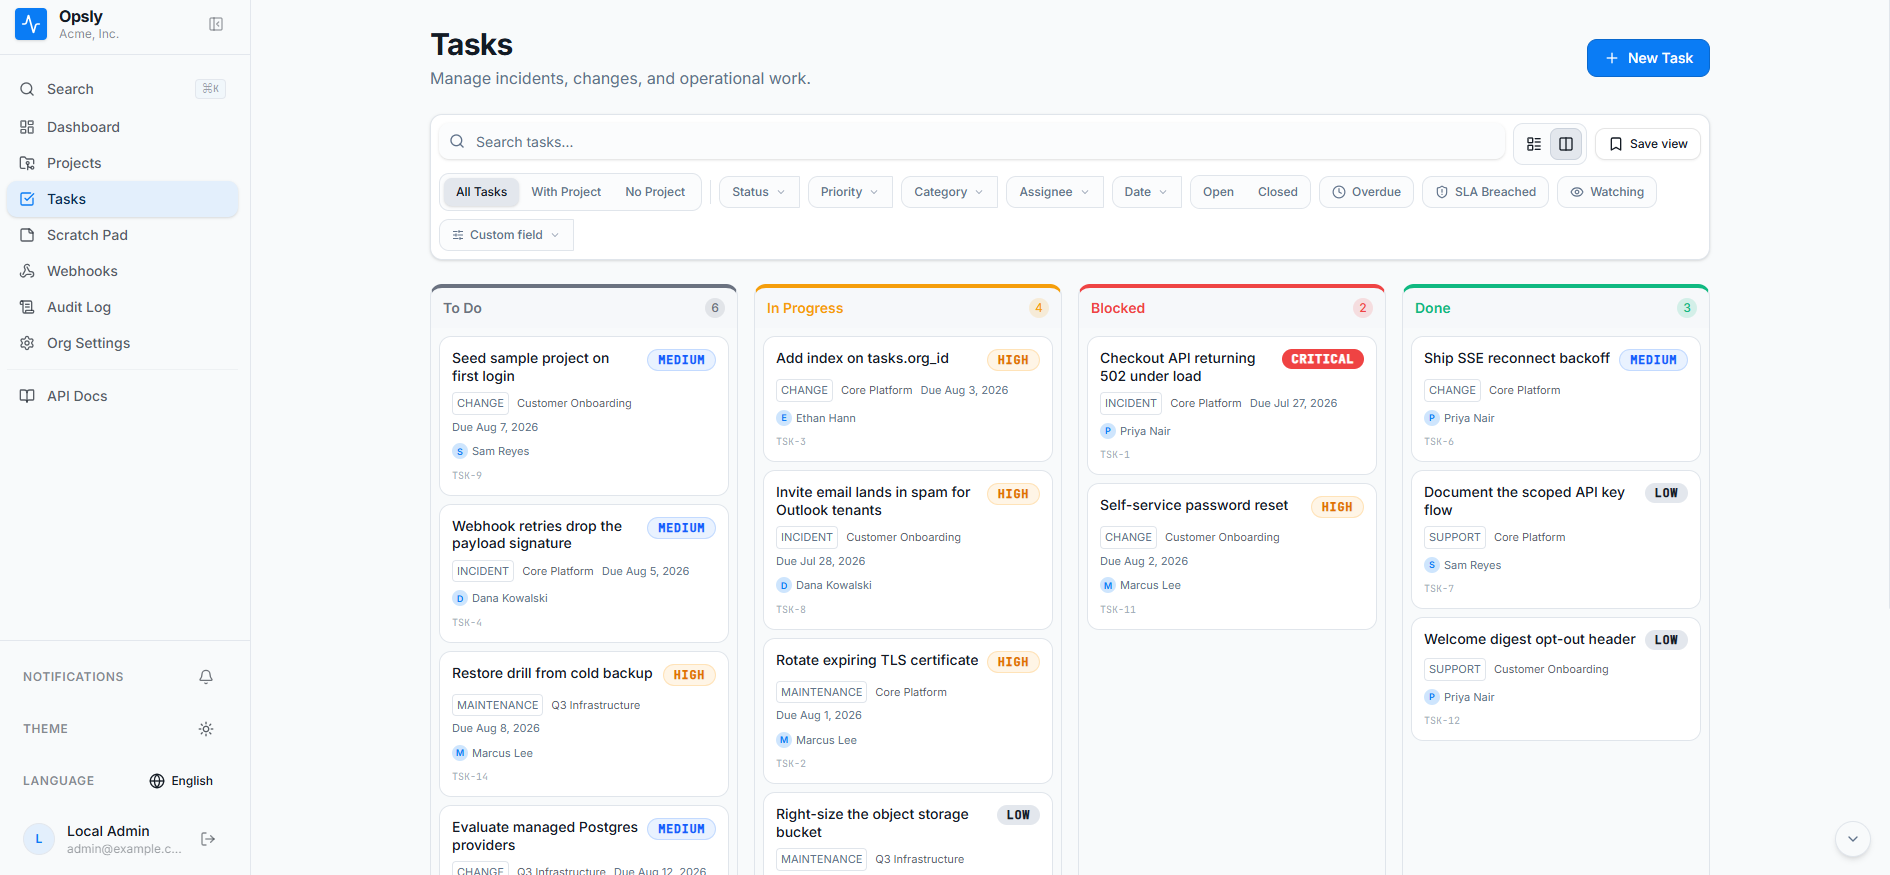
Filter across the whole organization by status, priority, category, assignee, date, or any custom field, then narrow to overdue or SLA-breached work and save the view.

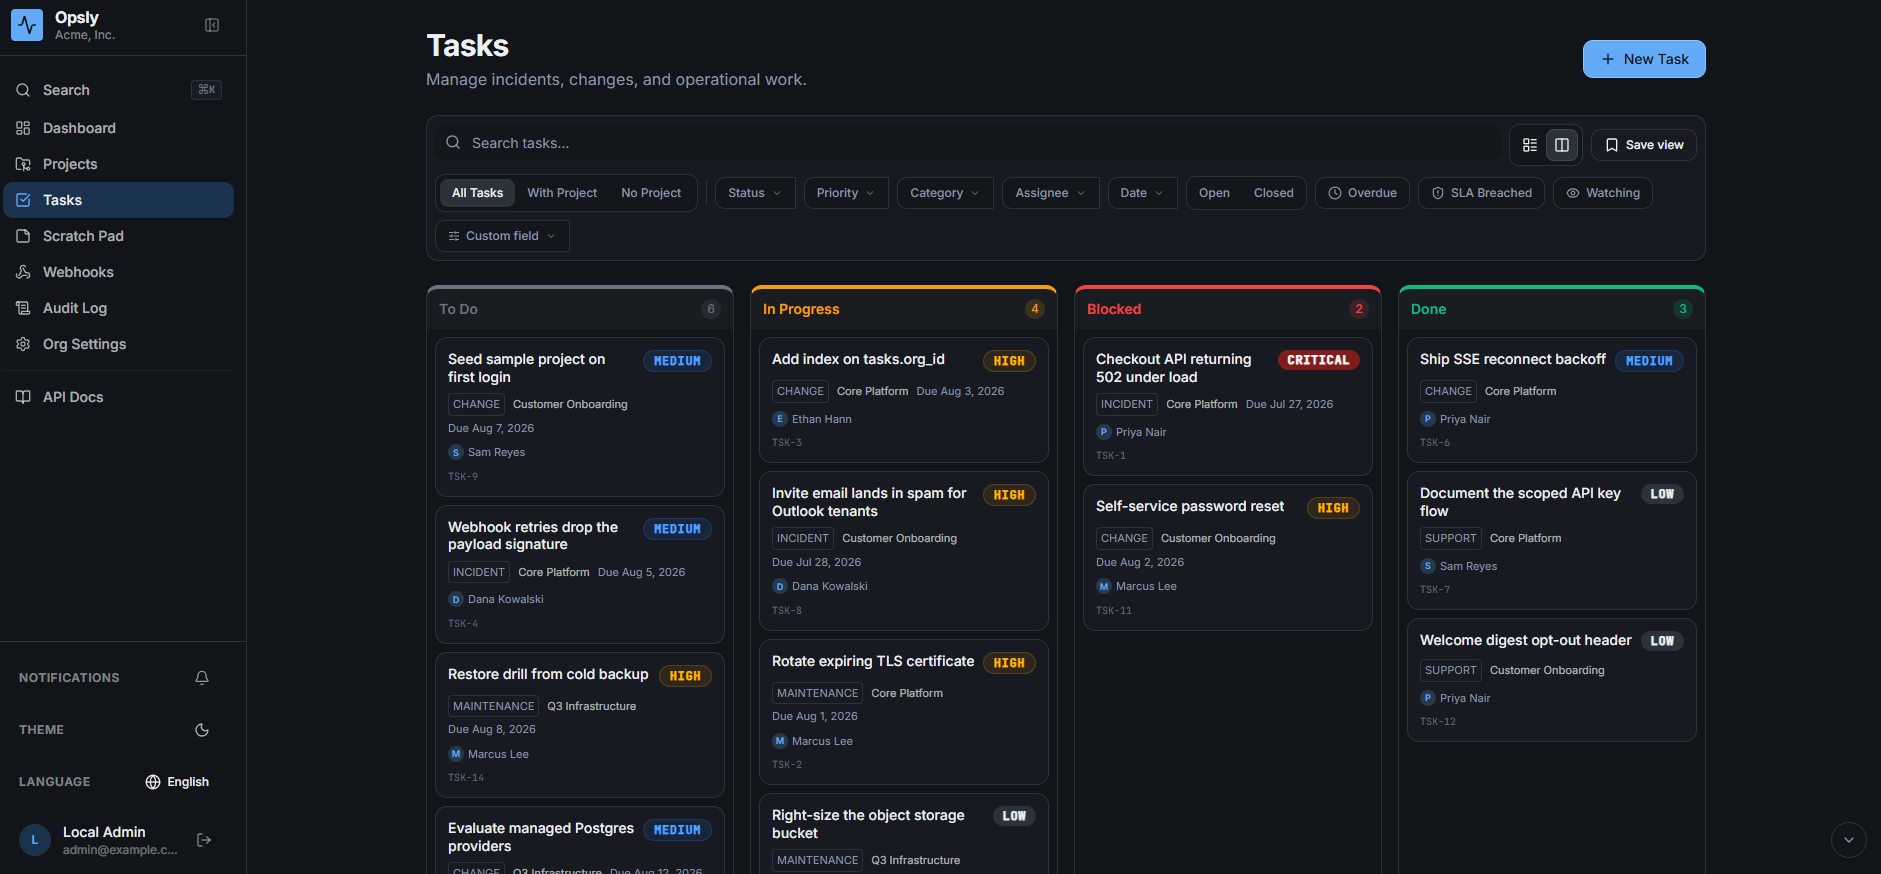
Opsly tasks page in Kanban view with filters for status, priority, category, assignee, date, overdue and SLA breached, above To Do, In Progress, Blocked and Done columns Opsly tasks page in dark mode, Kanban view with filter controls above the stage columns

All tasks

SLA countdowns that tick

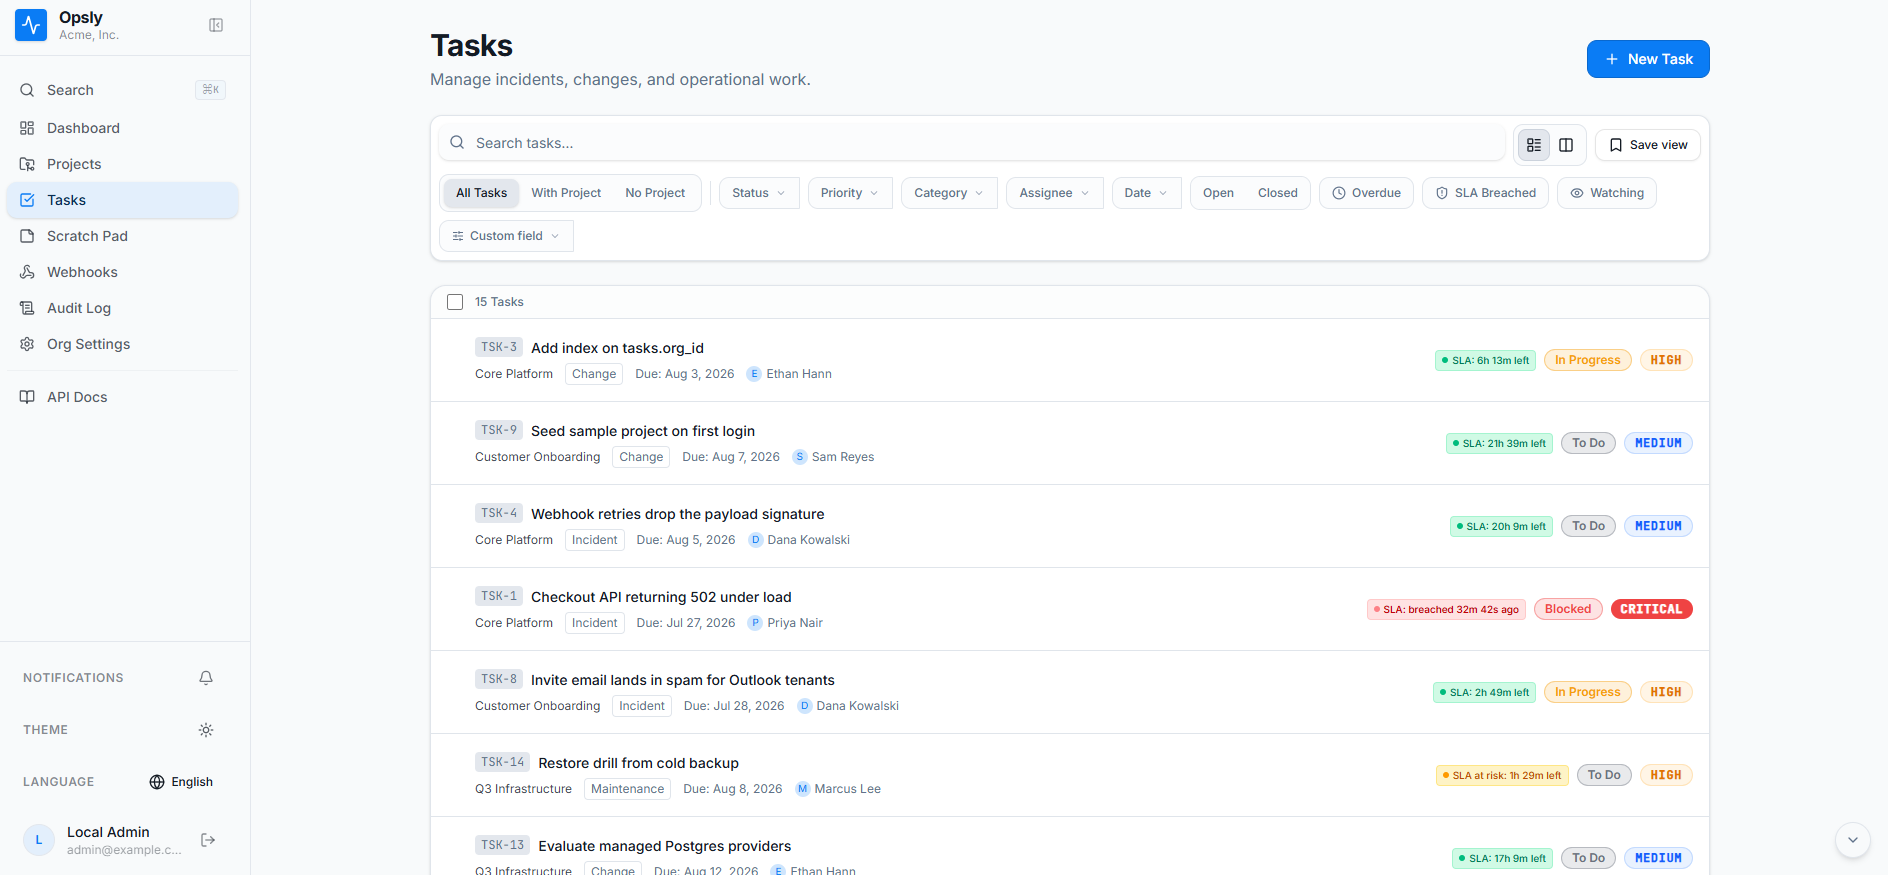
The same filters in a denser list. Every row carries a live countdown to its resolution target: time left, at risk, or how long ago it breached.

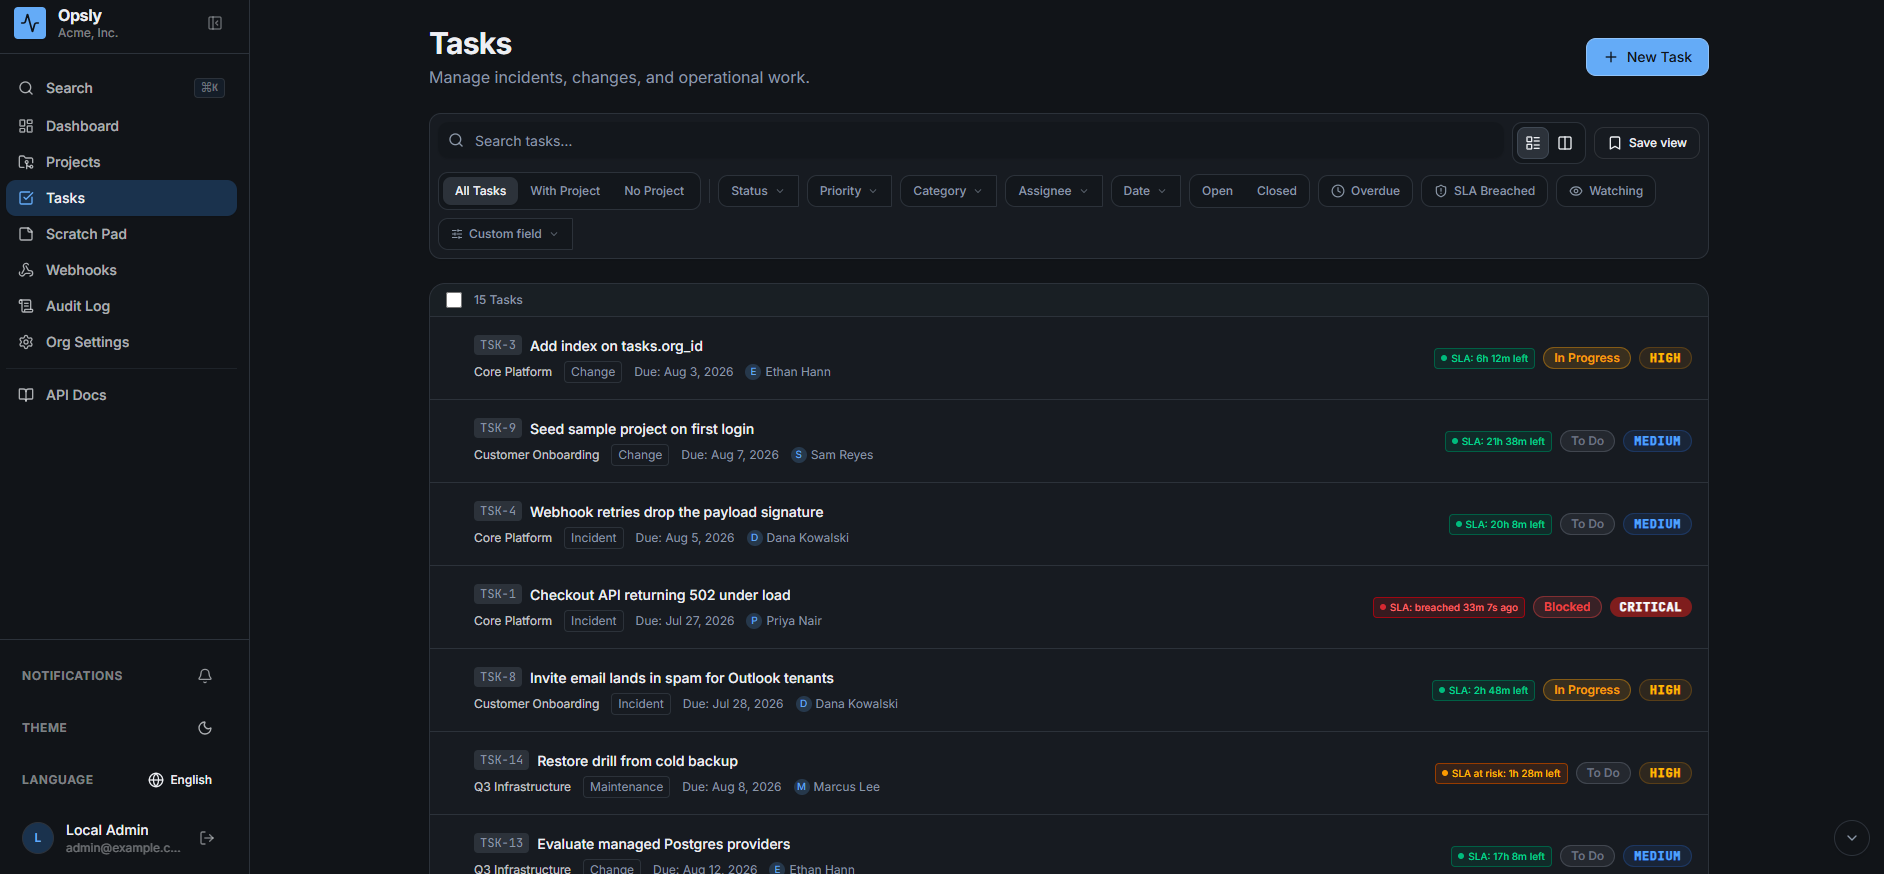
Opsly tasks list view where each row shows a live SLA badge such as 6 hours 13 minutes left, at risk, or breached 32 minutes ago, alongside stage and priority Opsly tasks list view in dark mode with live SLA badges on each row

Dependencies

Blocked work says so, in the way

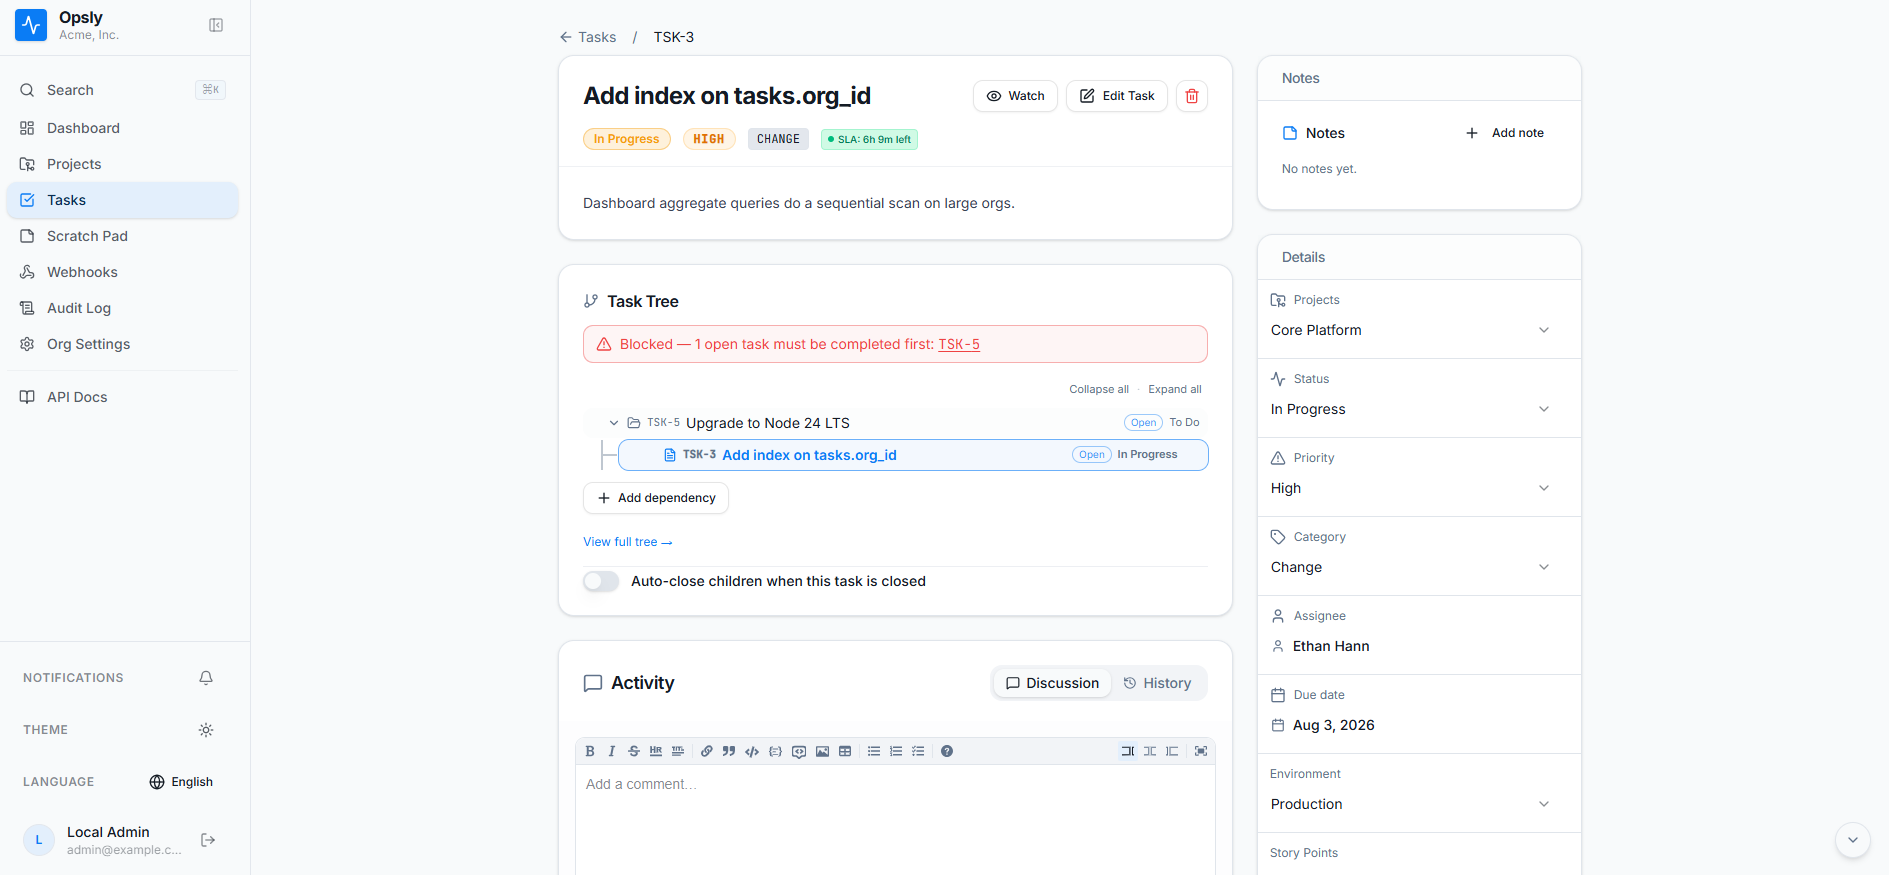
Open a task that depends on unfinished work and Opsly names the blocker instead of letting it slip through as ready. Closing a parent can cascade to its children.

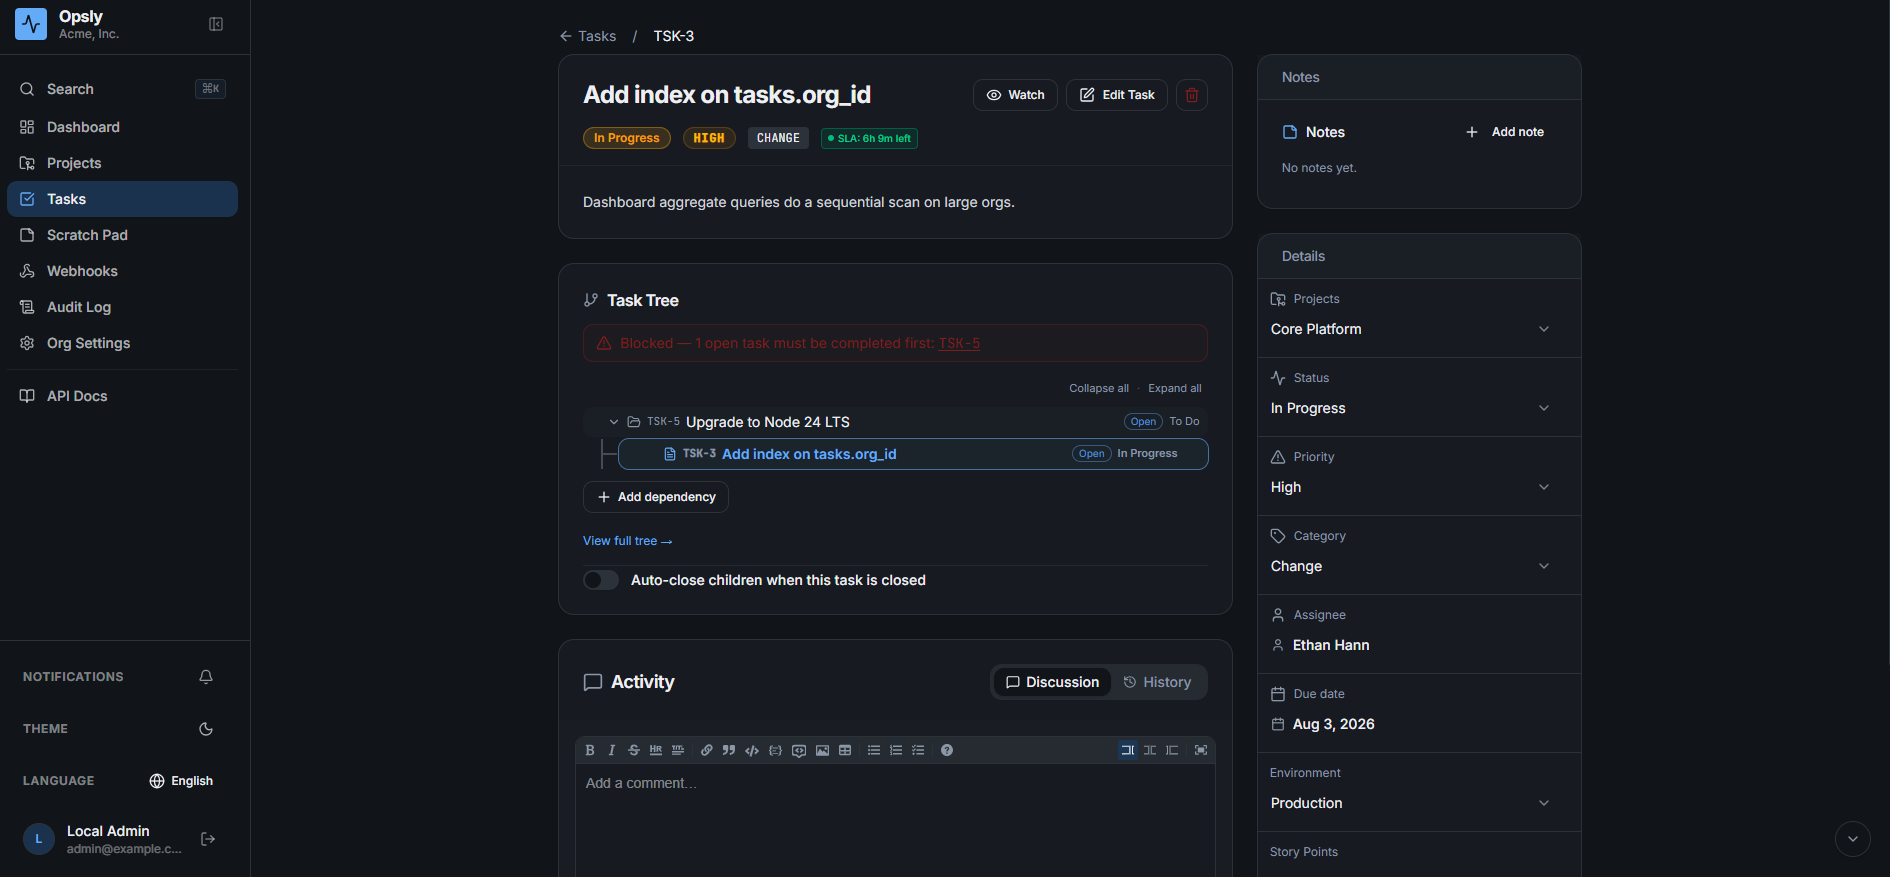
Opsly task detail page with a red banner reading blocked, one open task must be completed first, above the dependency tree and an auto-close children toggle Opsly task detail page in dark mode with a blocked banner above the dependency tree

Dependencies

The whole chain, per project

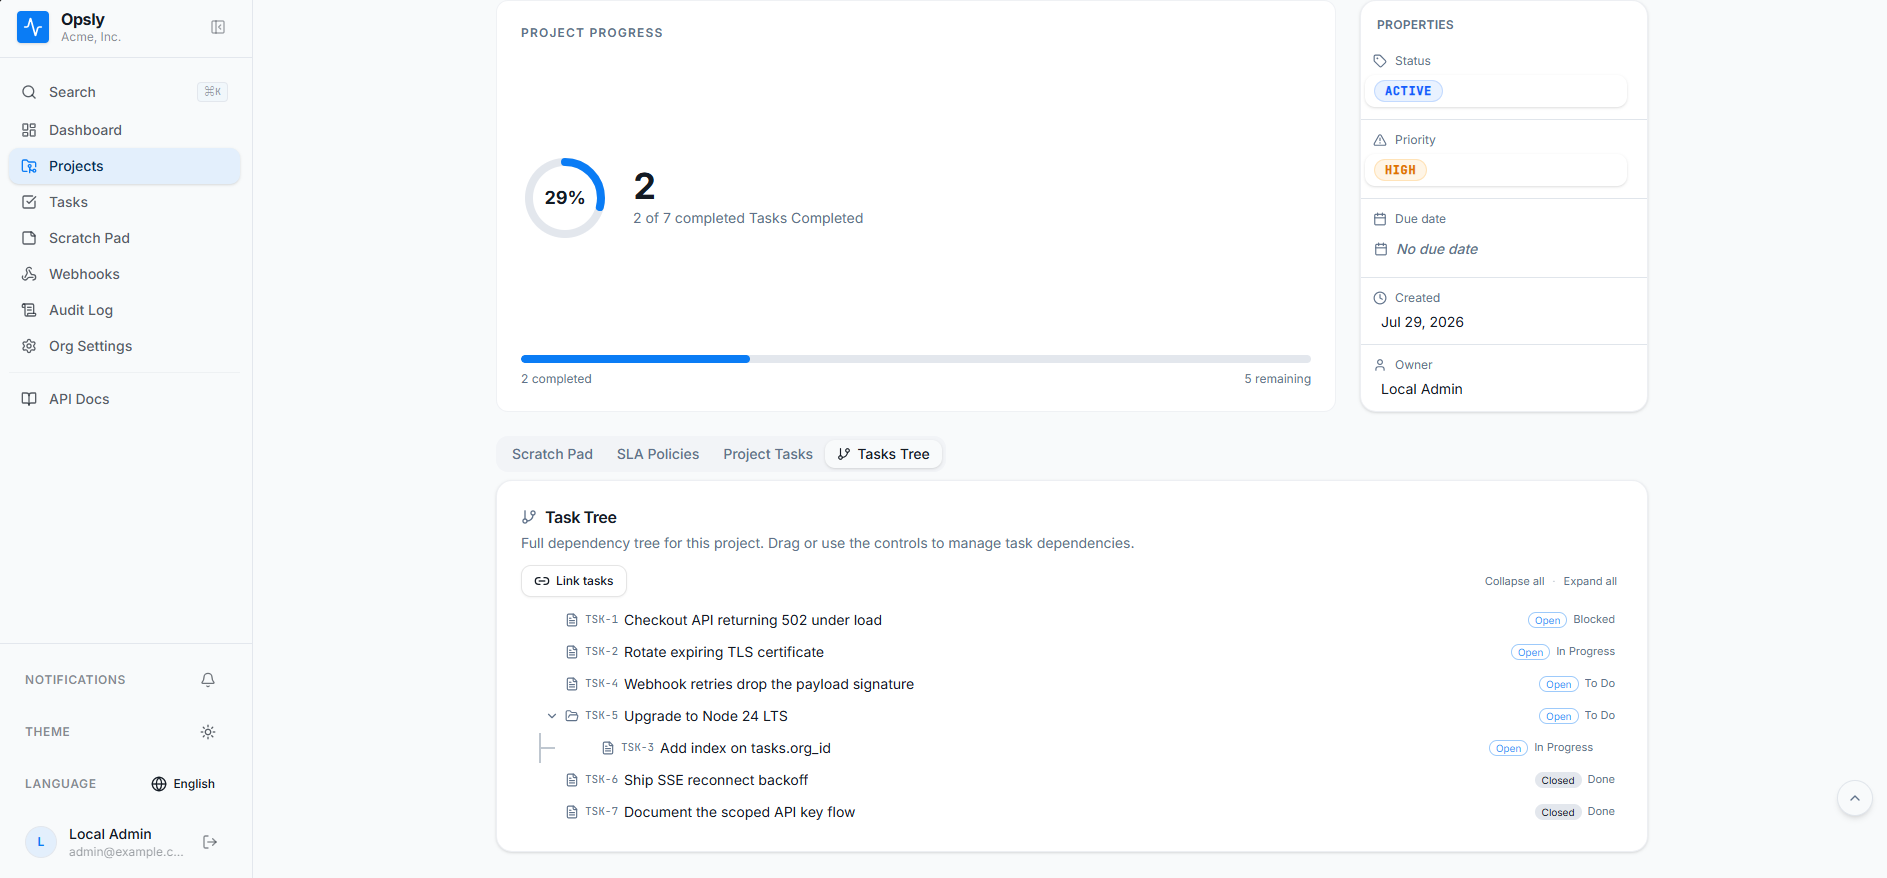
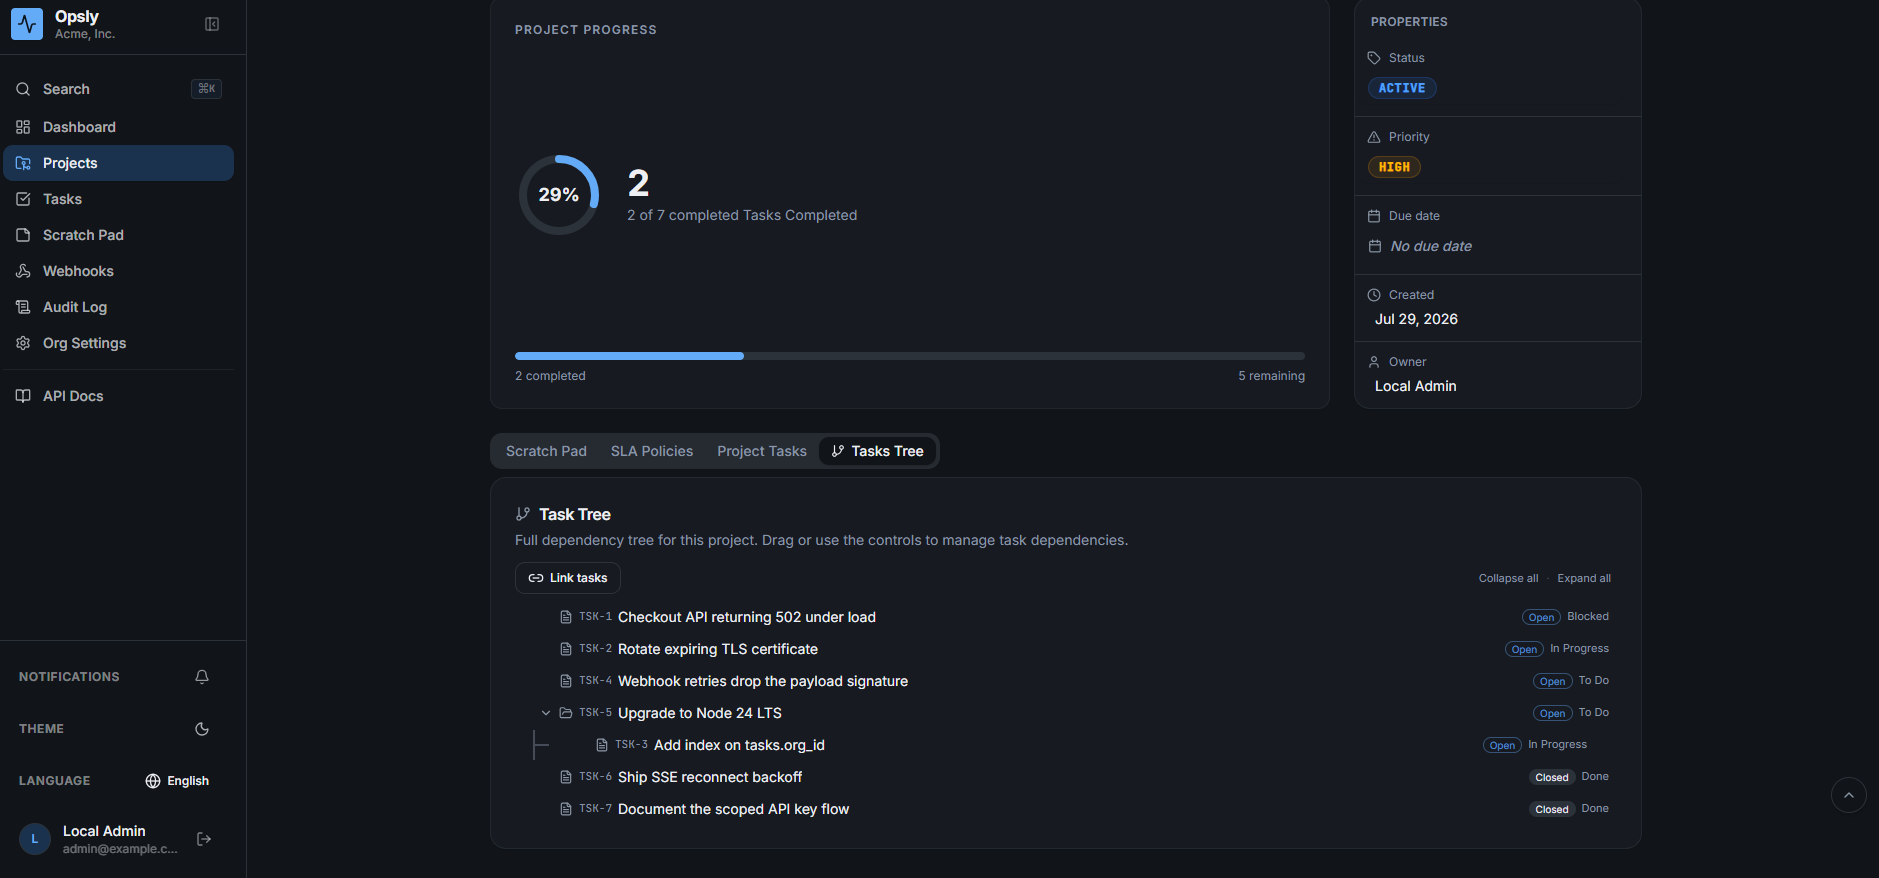
The project's full dependency tree, nested and collapsible, with each task's open or closed state and current stage on the right. Link tasks directly from here.

Opsly project task tree showing a nested dependency hierarchy with open and closed states and stage labels for each task Opsly project task tree in dark mode showing a nested dependency hierarchy

Org settings · Stages

Define the stages work moves through

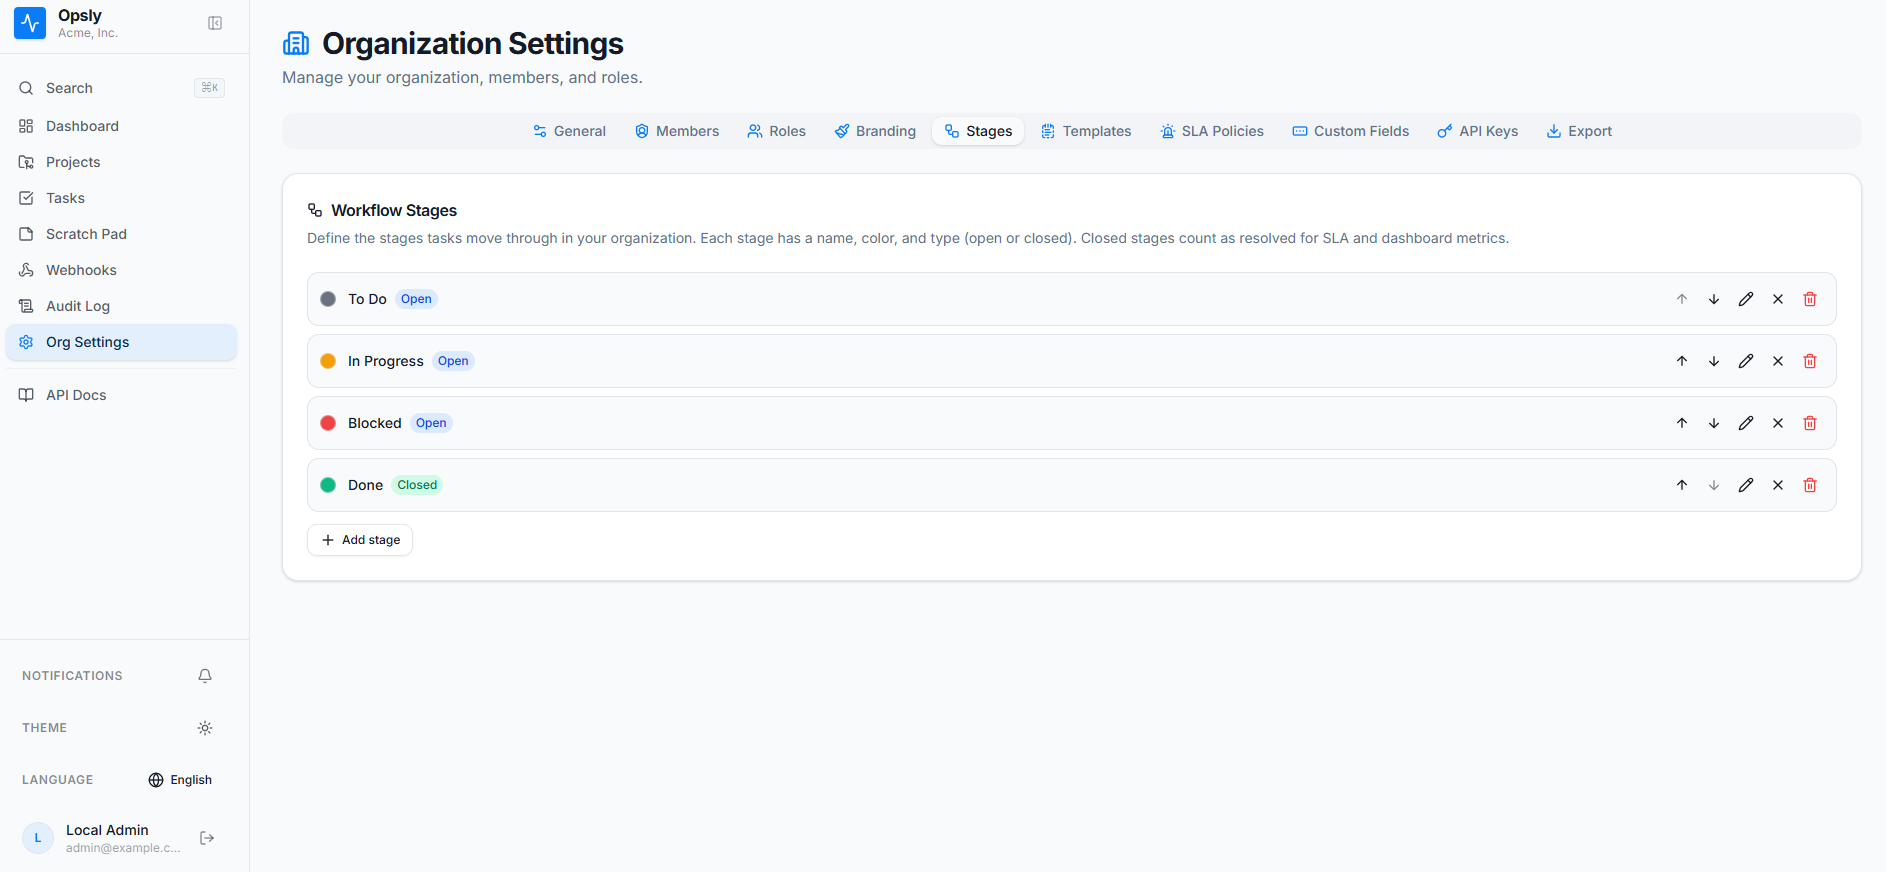
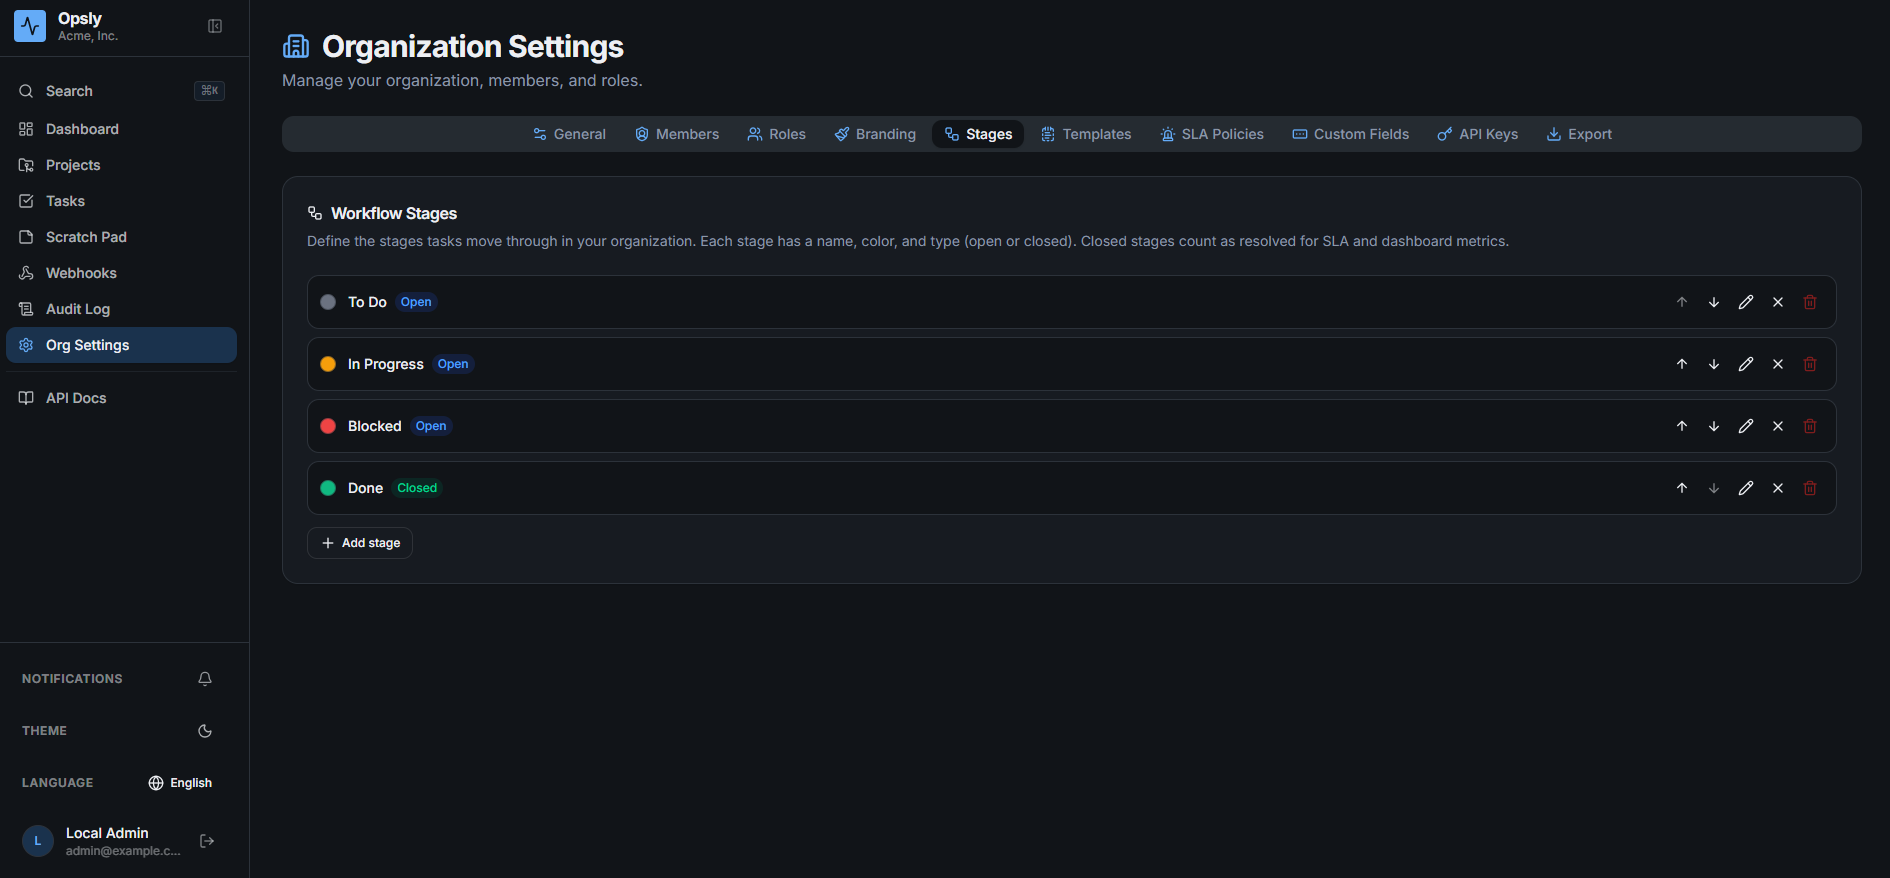
Every organization starts with four and can rename, recolor, reorder, or add more. Stages typed closed are what SLA and dashboard math counts as resolved.

Opsly organization settings on the Stages tab, listing To Do, In Progress, Blocked and Done with their colors and open or closed types Opsly organization settings Stages tab in dark mode listing the four workflow stages

Org settings · Custom fields

Typed fields on every task

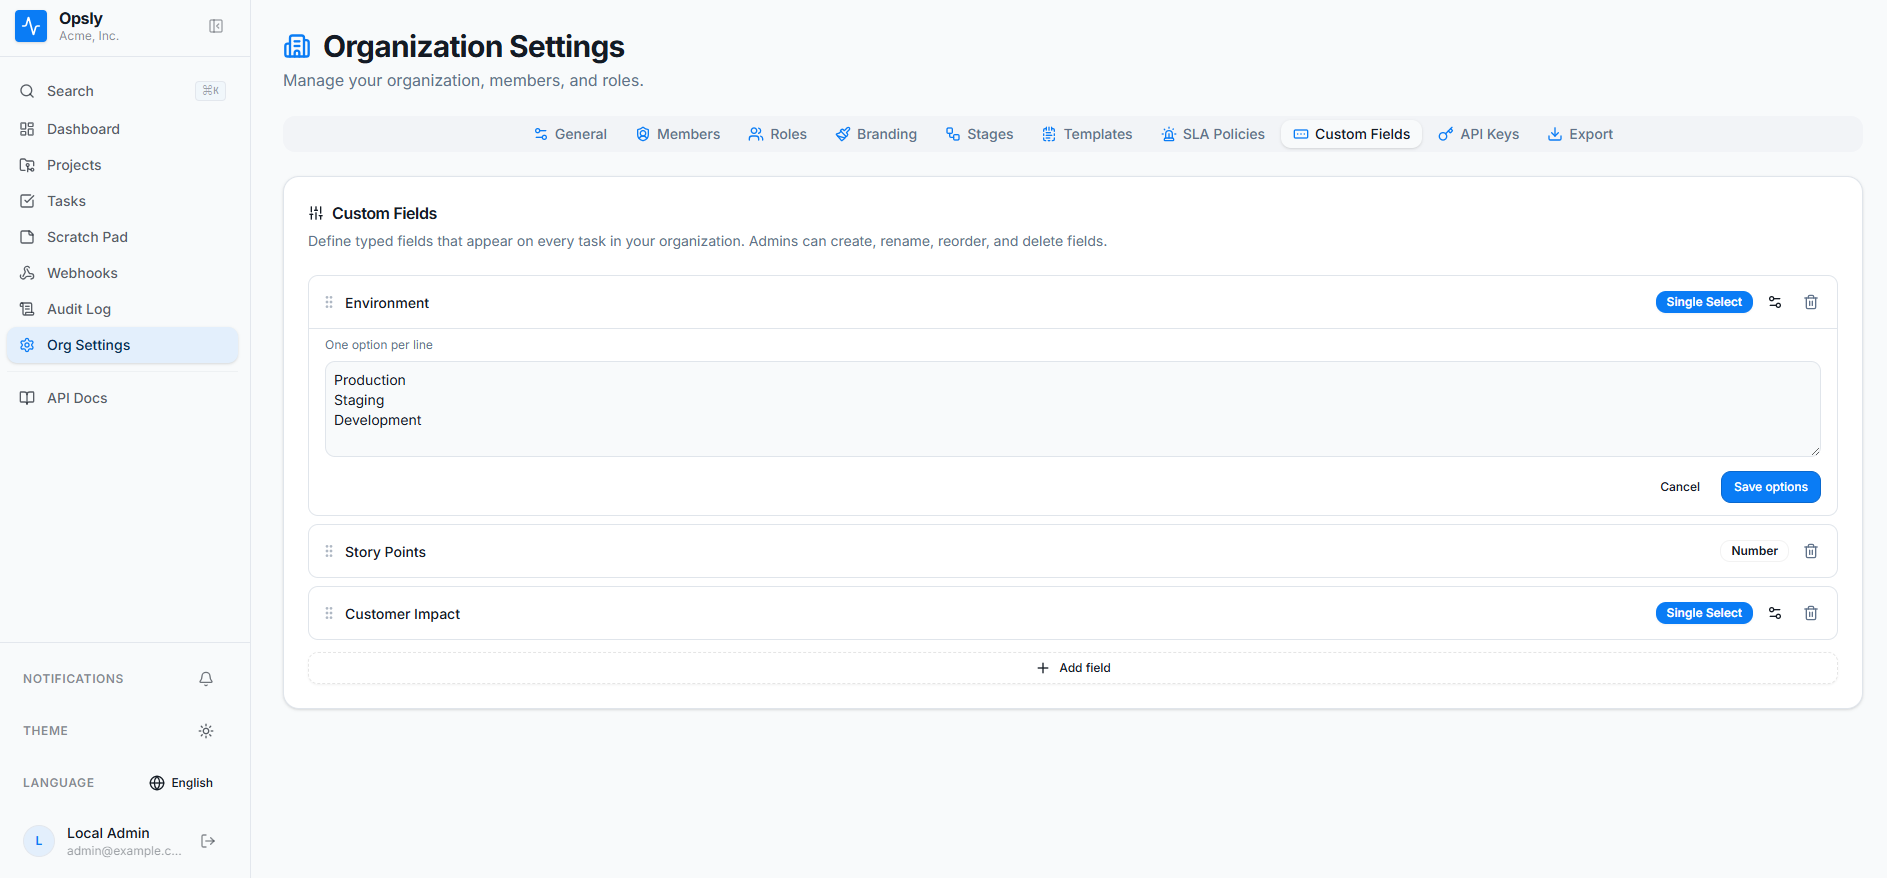
Text, number, date, single select, and multi select. Define the options once and they appear on every task in the organization, filterable from the task list.

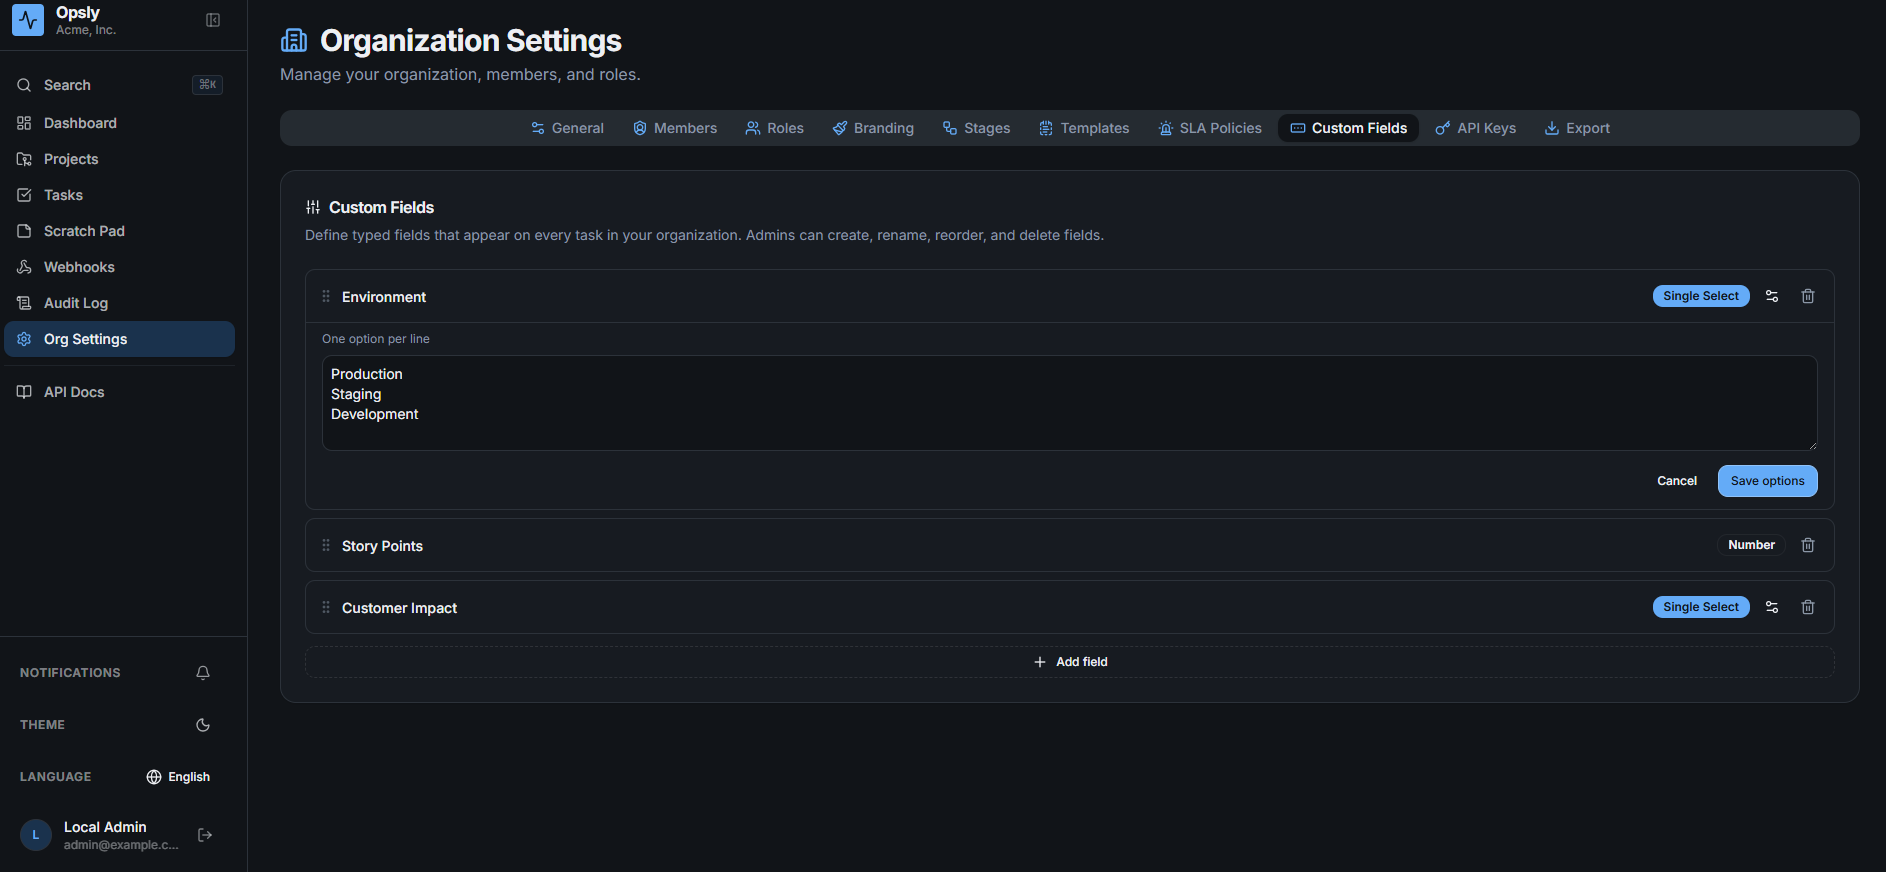
Opsly organization settings on the Custom Fields tab showing an Environment single select with Production, Staging and Development options, plus Story Points as a number field Opsly organization settings Custom Fields tab in dark mode showing typed field definitions

Org settings · Branding

Make a shared instance feel like yours

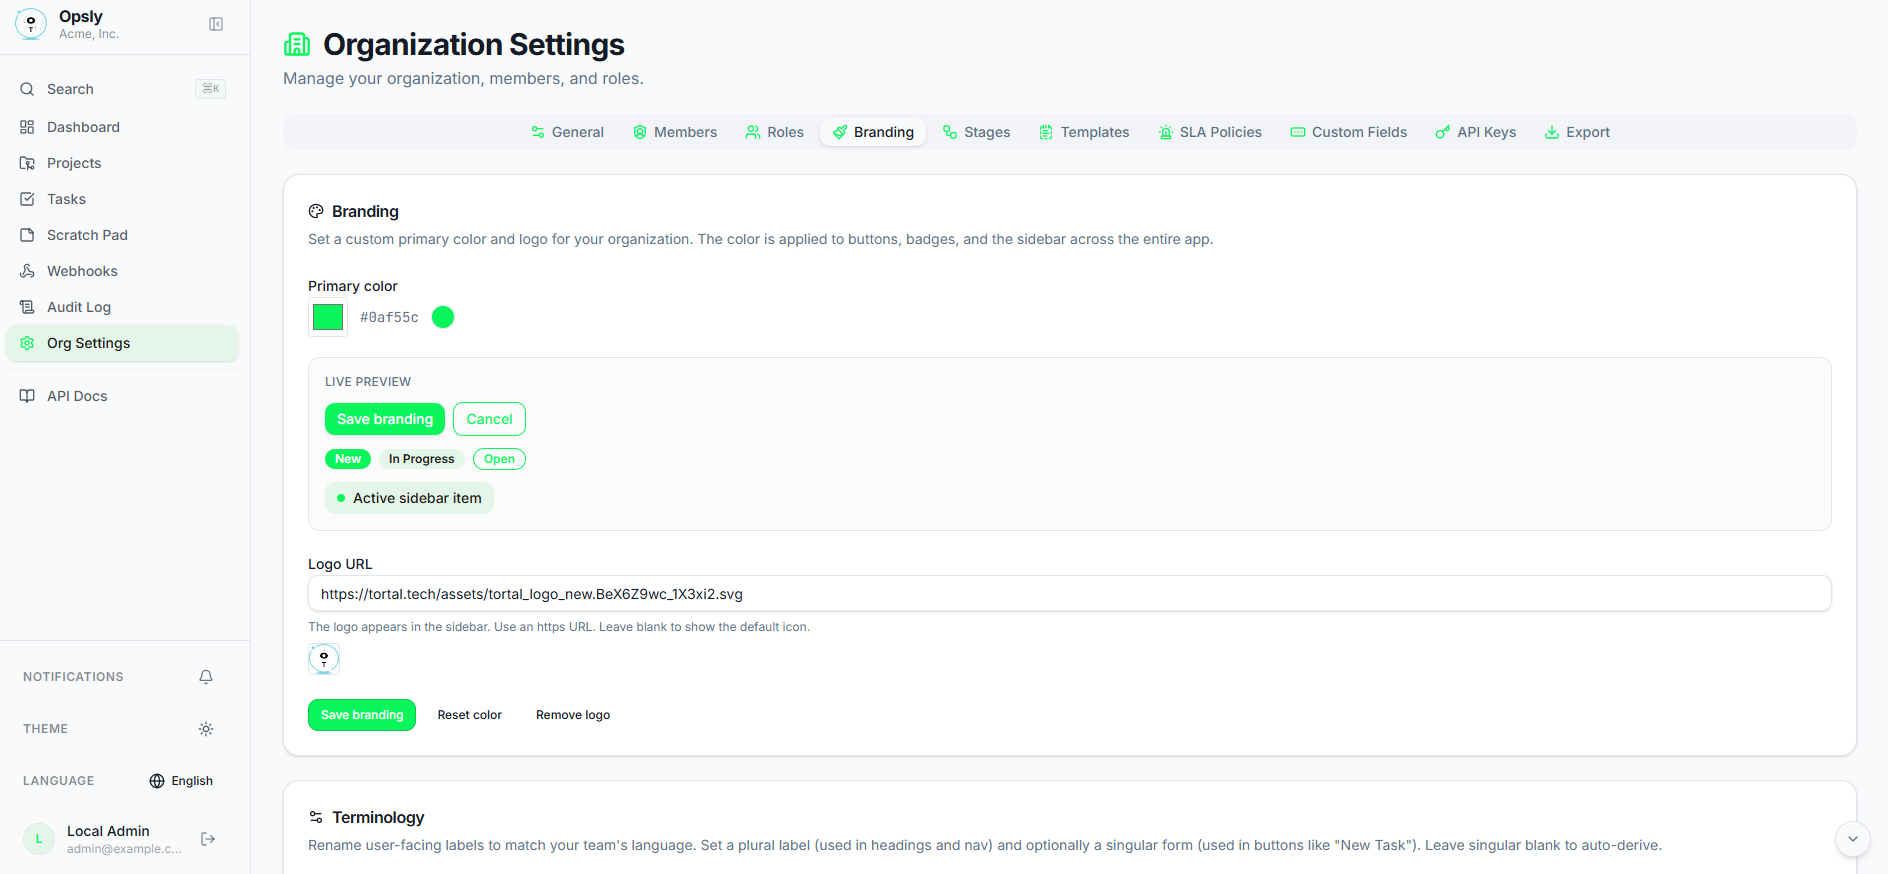
Set a primary color and logo per organization, previewed live before you save. Below it, terminology: rename tasks to tickets, projects to epics, whatever your team already says.

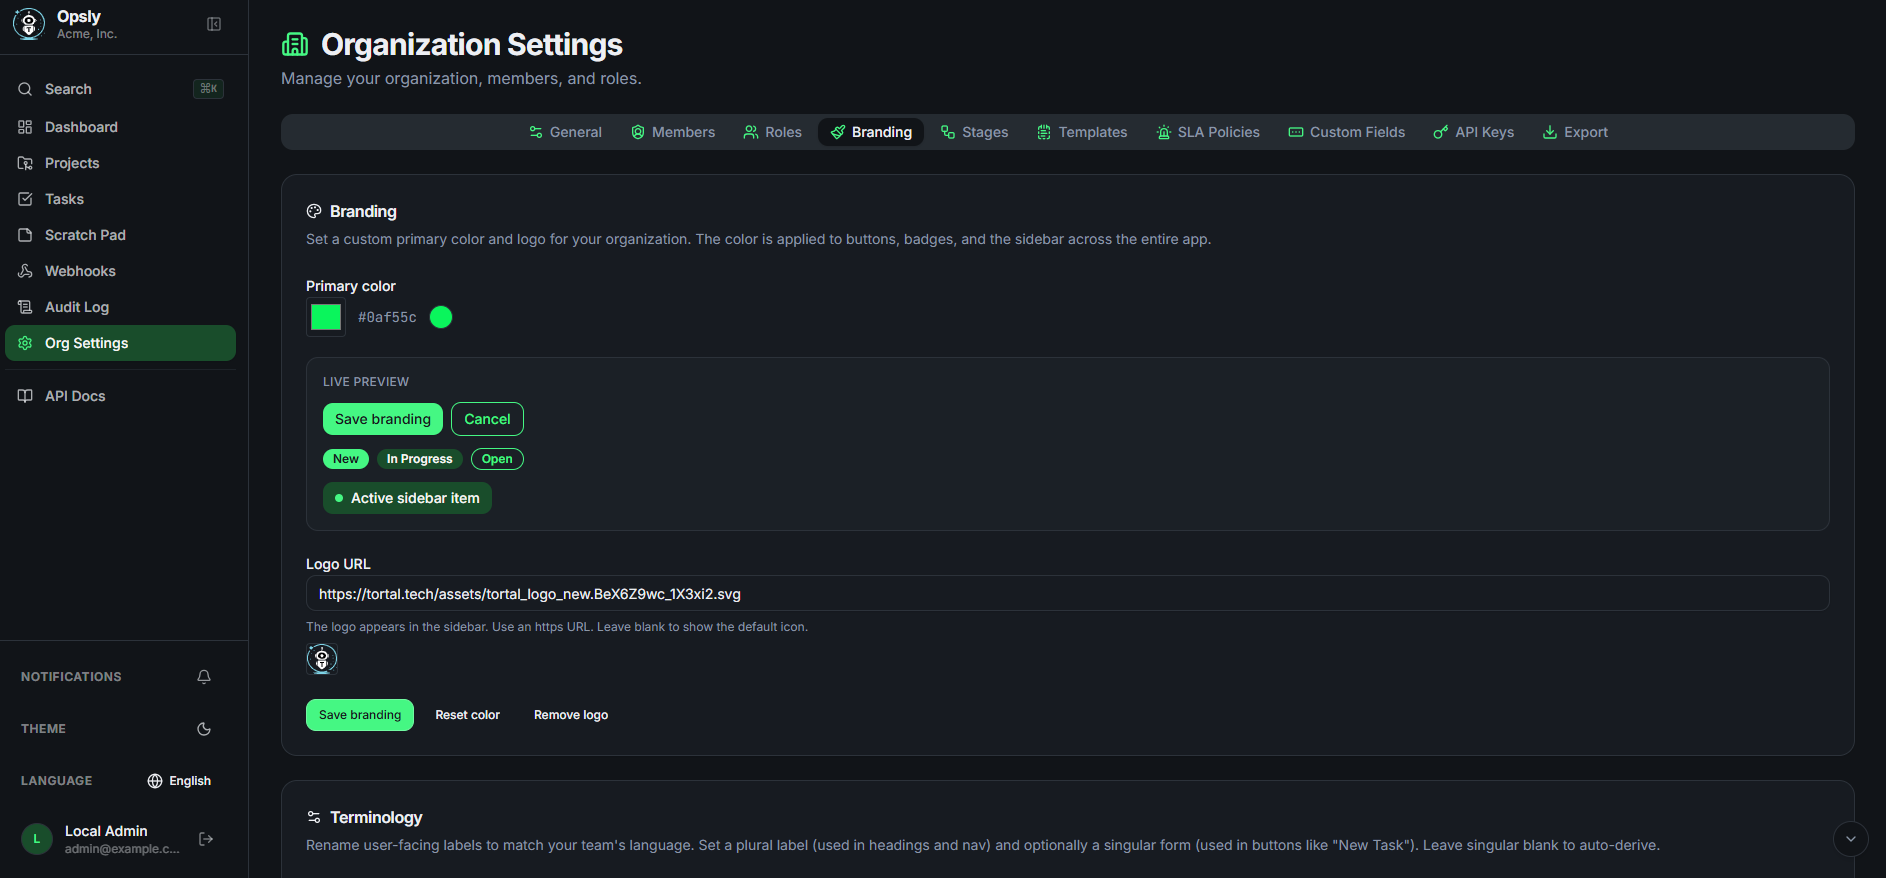
Opsly organization settings on the Branding tab with a green primary color applied to a live preview of buttons, badges and the sidebar, a logo URL field, and the terminology section below Opsly organization settings Branding tab in dark mode with a custom primary color and live preview

Audit log

Who changed what, and when the system did

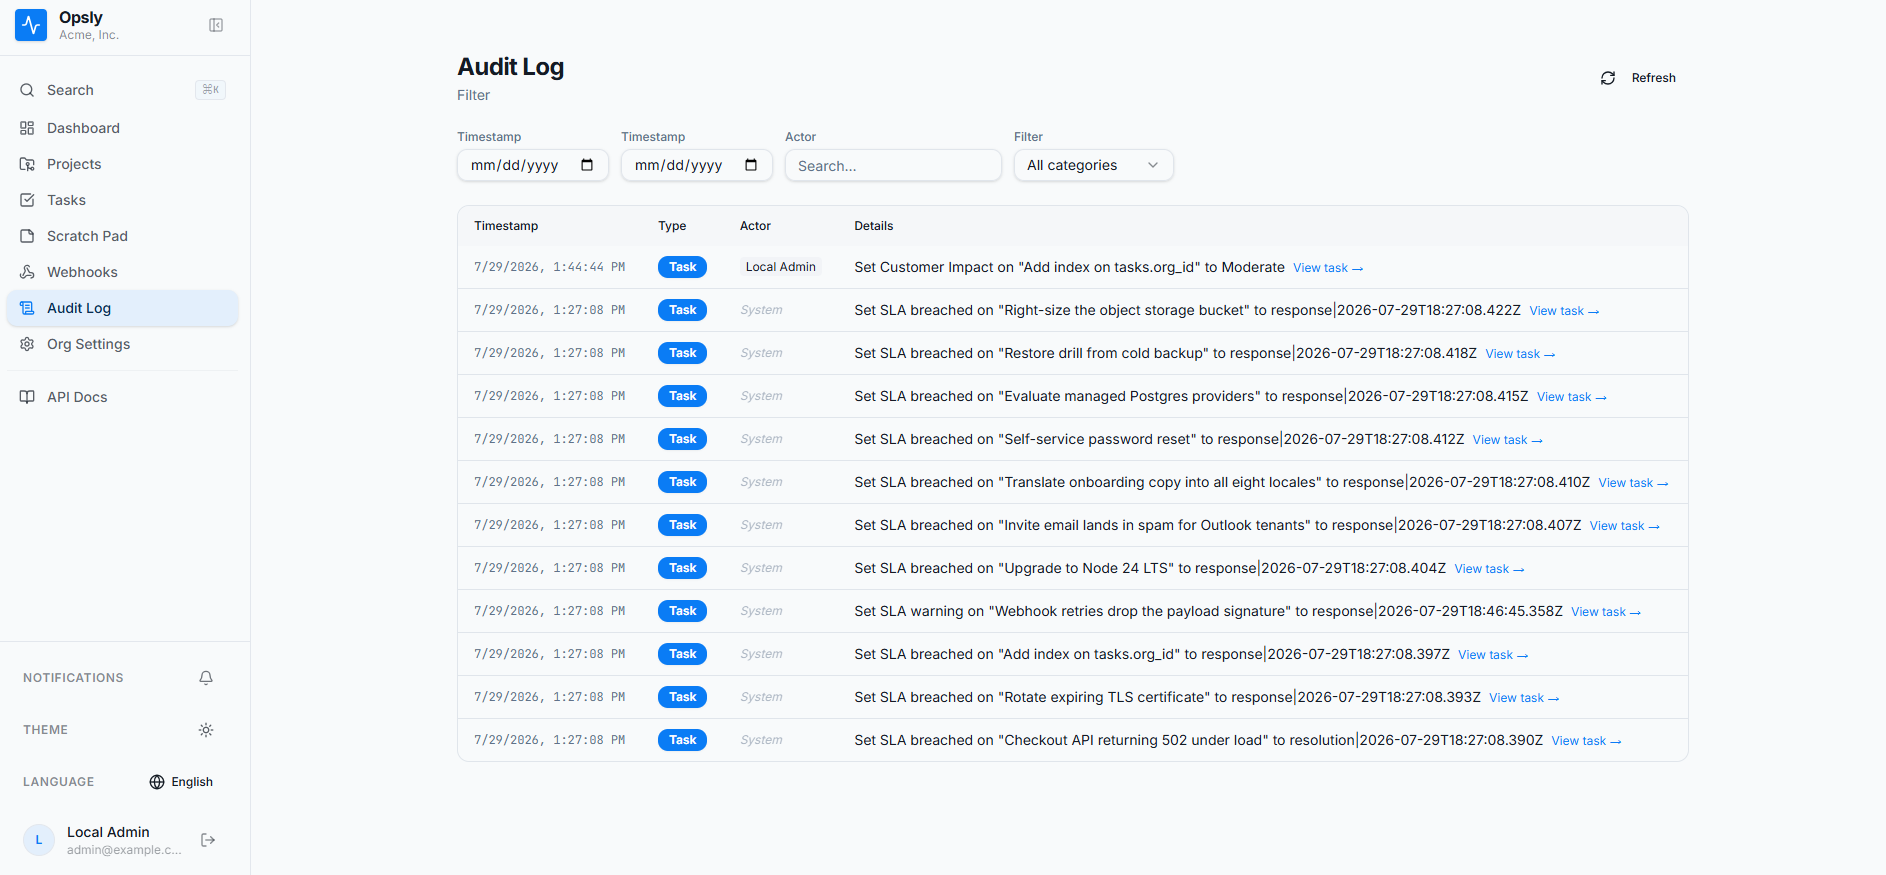
Filter by date range, actor, or category. Alongside people, the system records itself: every SLA warning and breach it detects lands in the same trail.

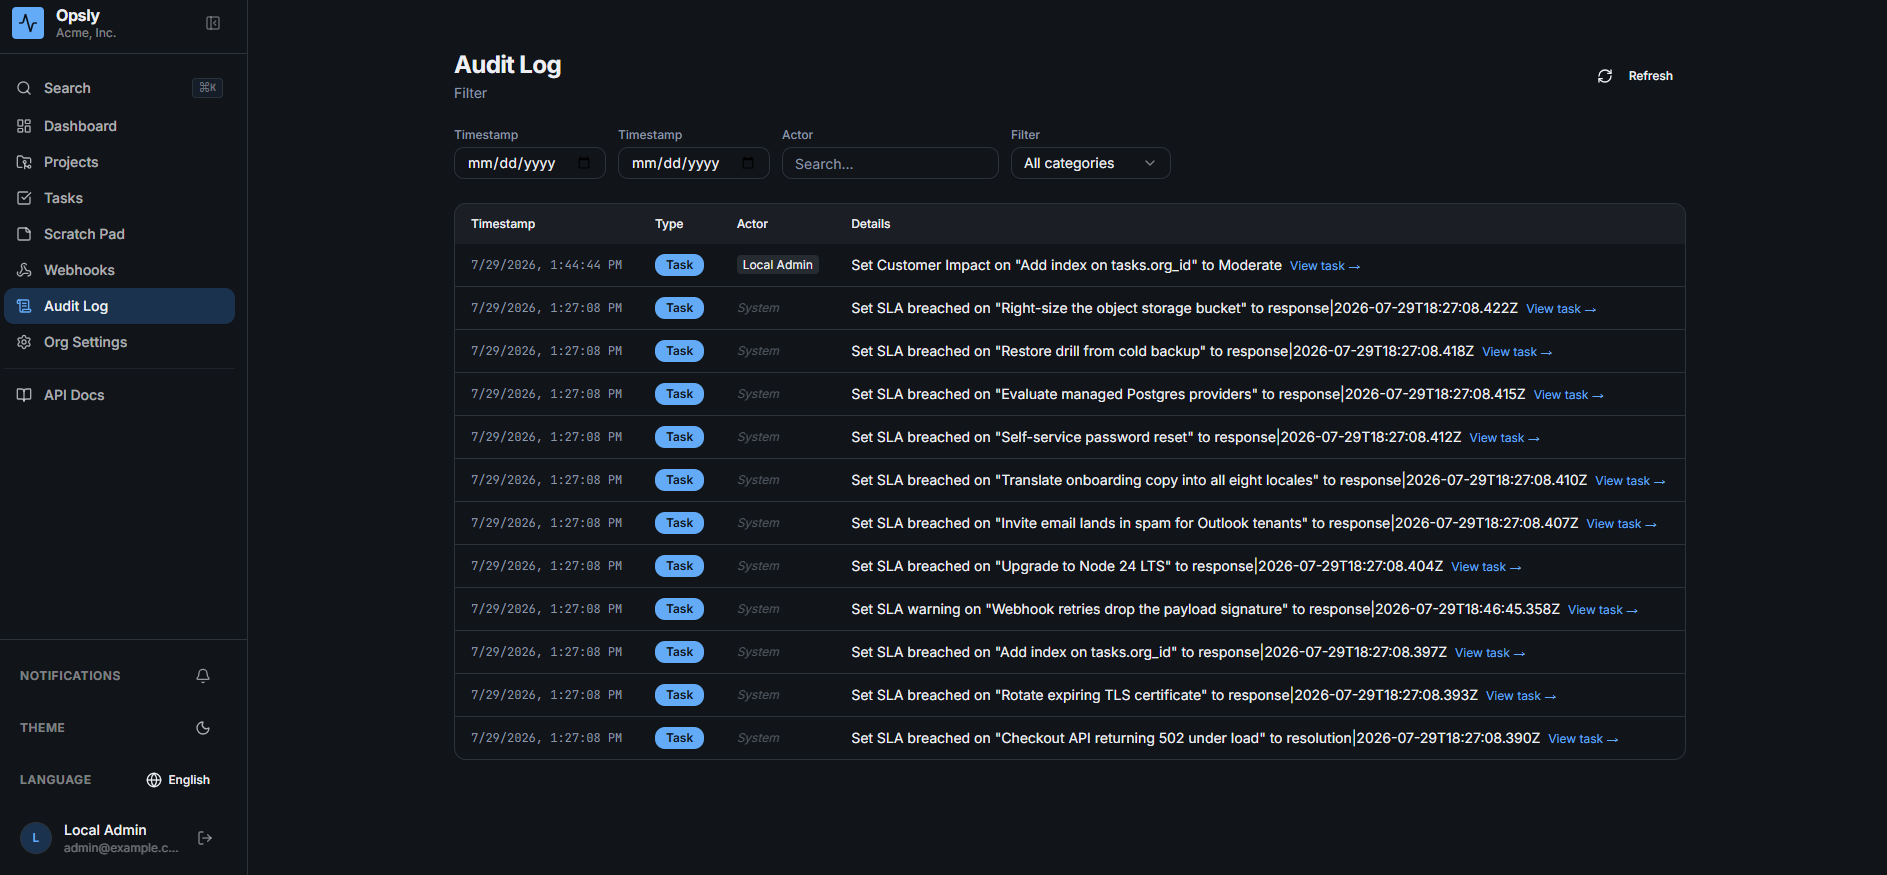
Opsly audit log filtered by timestamp, actor and category, listing entries from a local admin alongside system-generated SLA breach and warning records Opsly audit log in dark mode listing user and system entries with filters above

Scratch pad

Markdown with a live preview

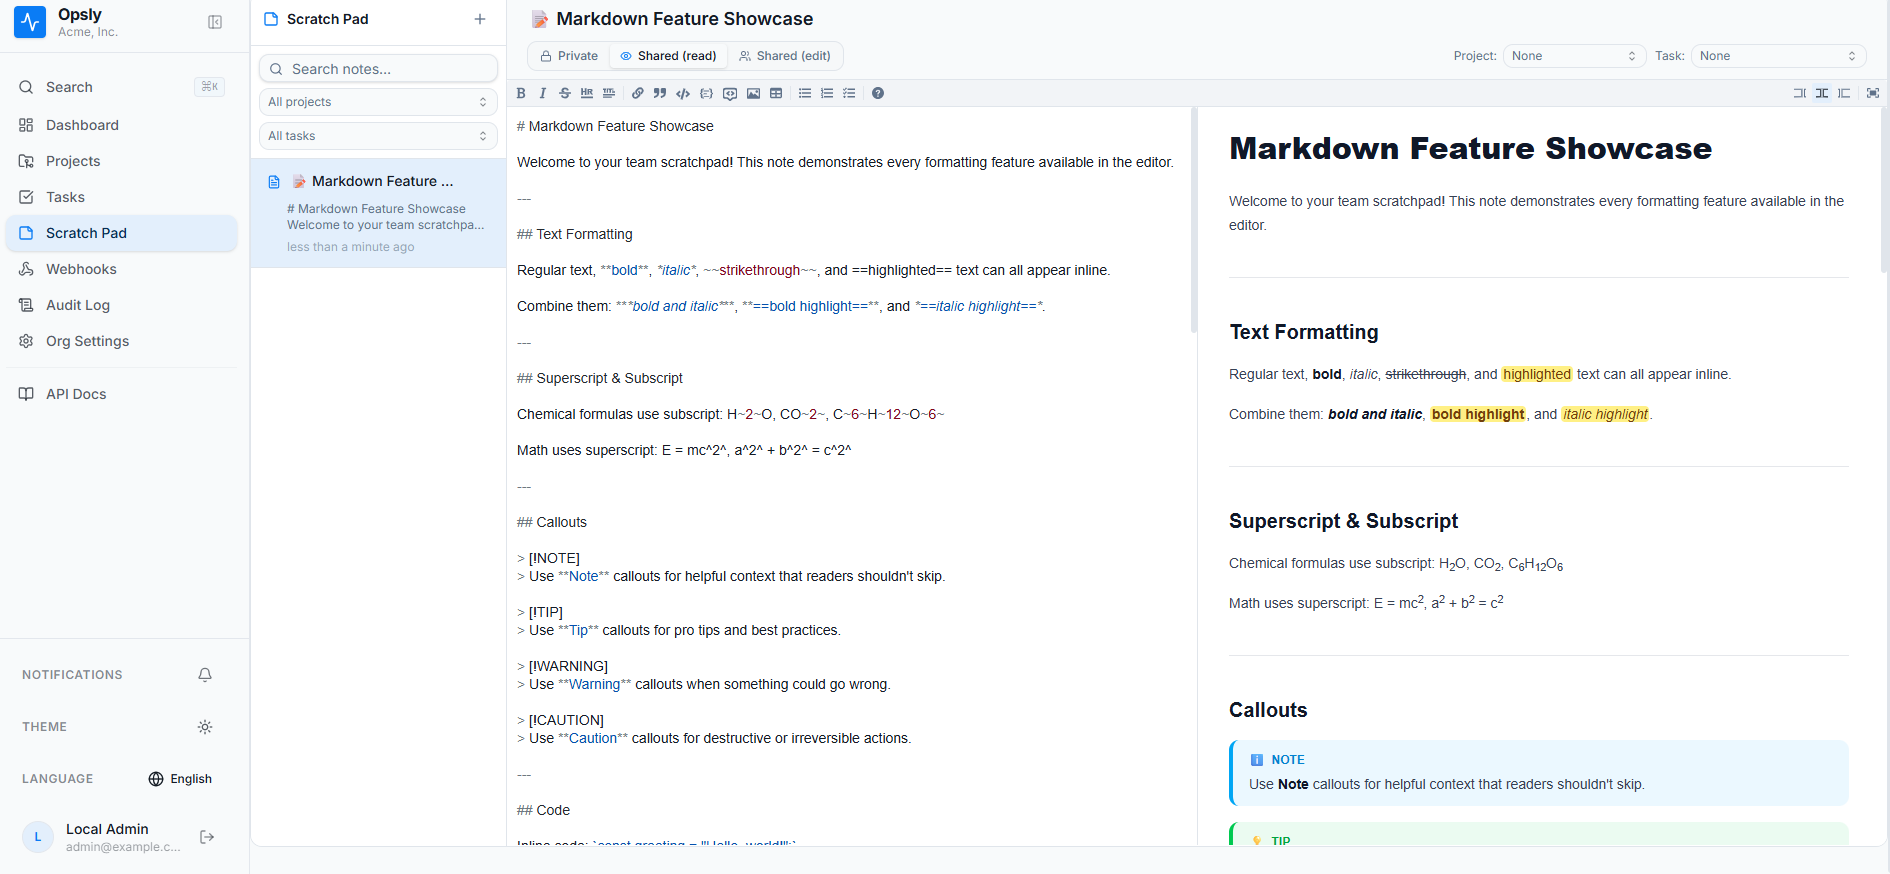
Notes render as you type, with callouts, tables, code, superscript, and Mermaid diagrams. Keep one private, share it read-only, or let the team edit it.

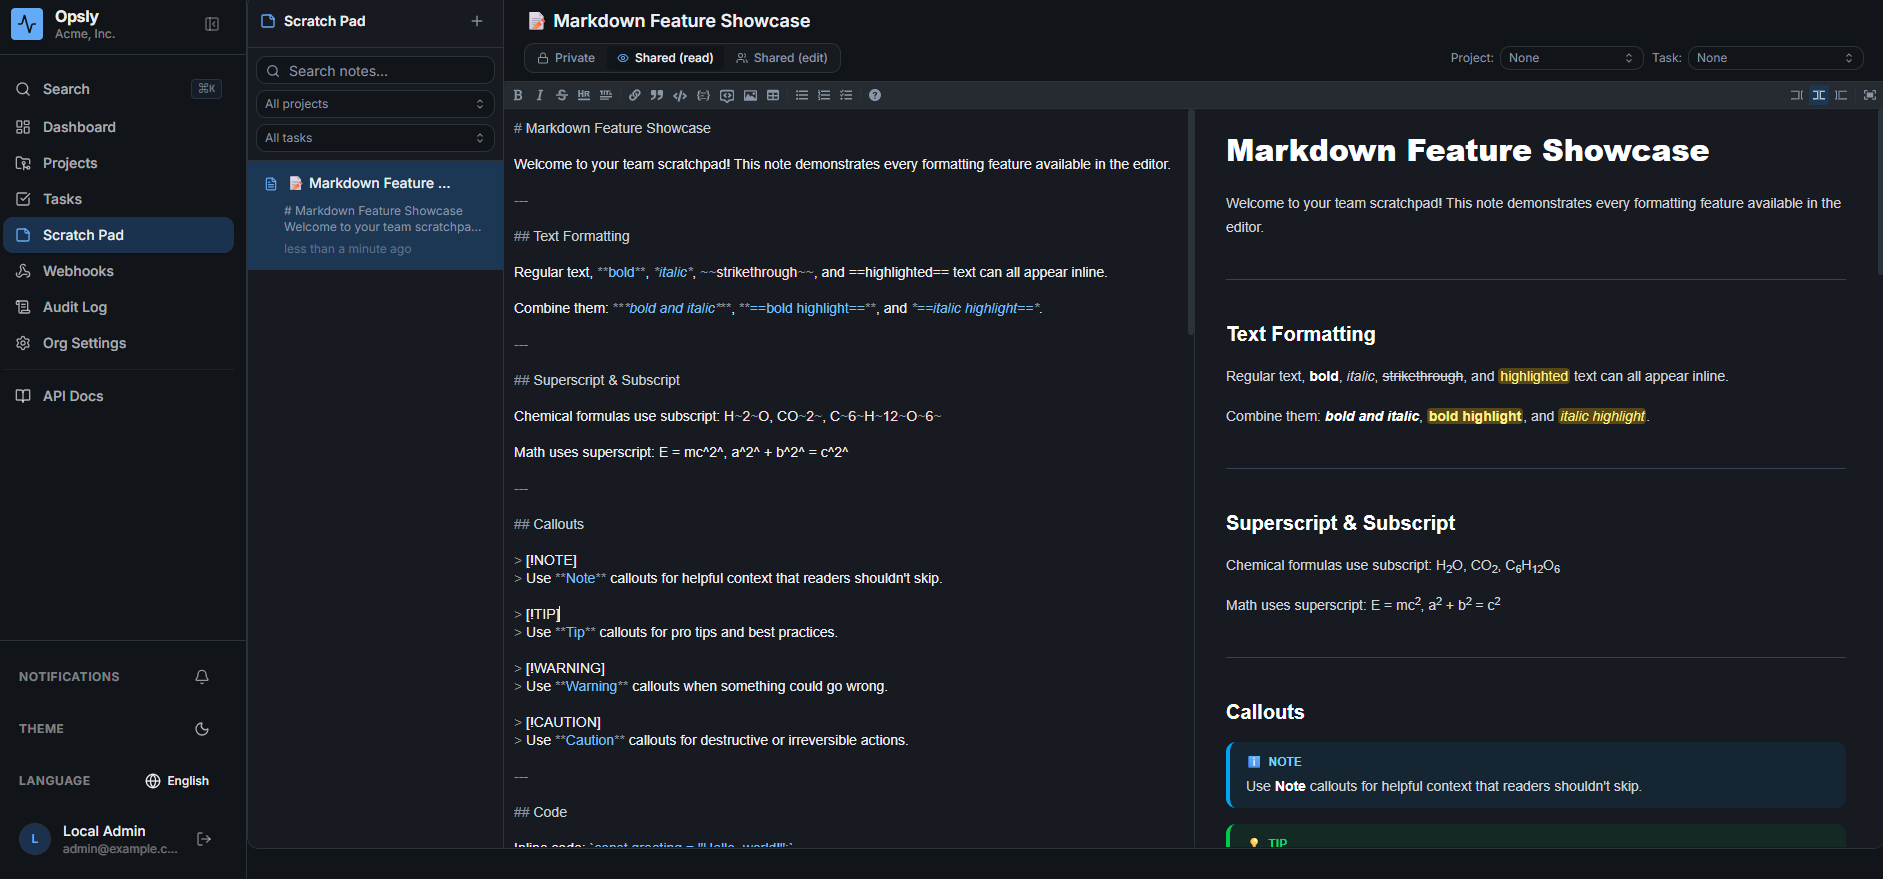
Opsly scratch pad with a Markdown source pane on the left and a rendered preview on the right showing formatted text, superscript, subscript and note callouts Opsly scratch pad in dark mode with Markdown source beside a rendered live preview

Instance admin

One console above every organization

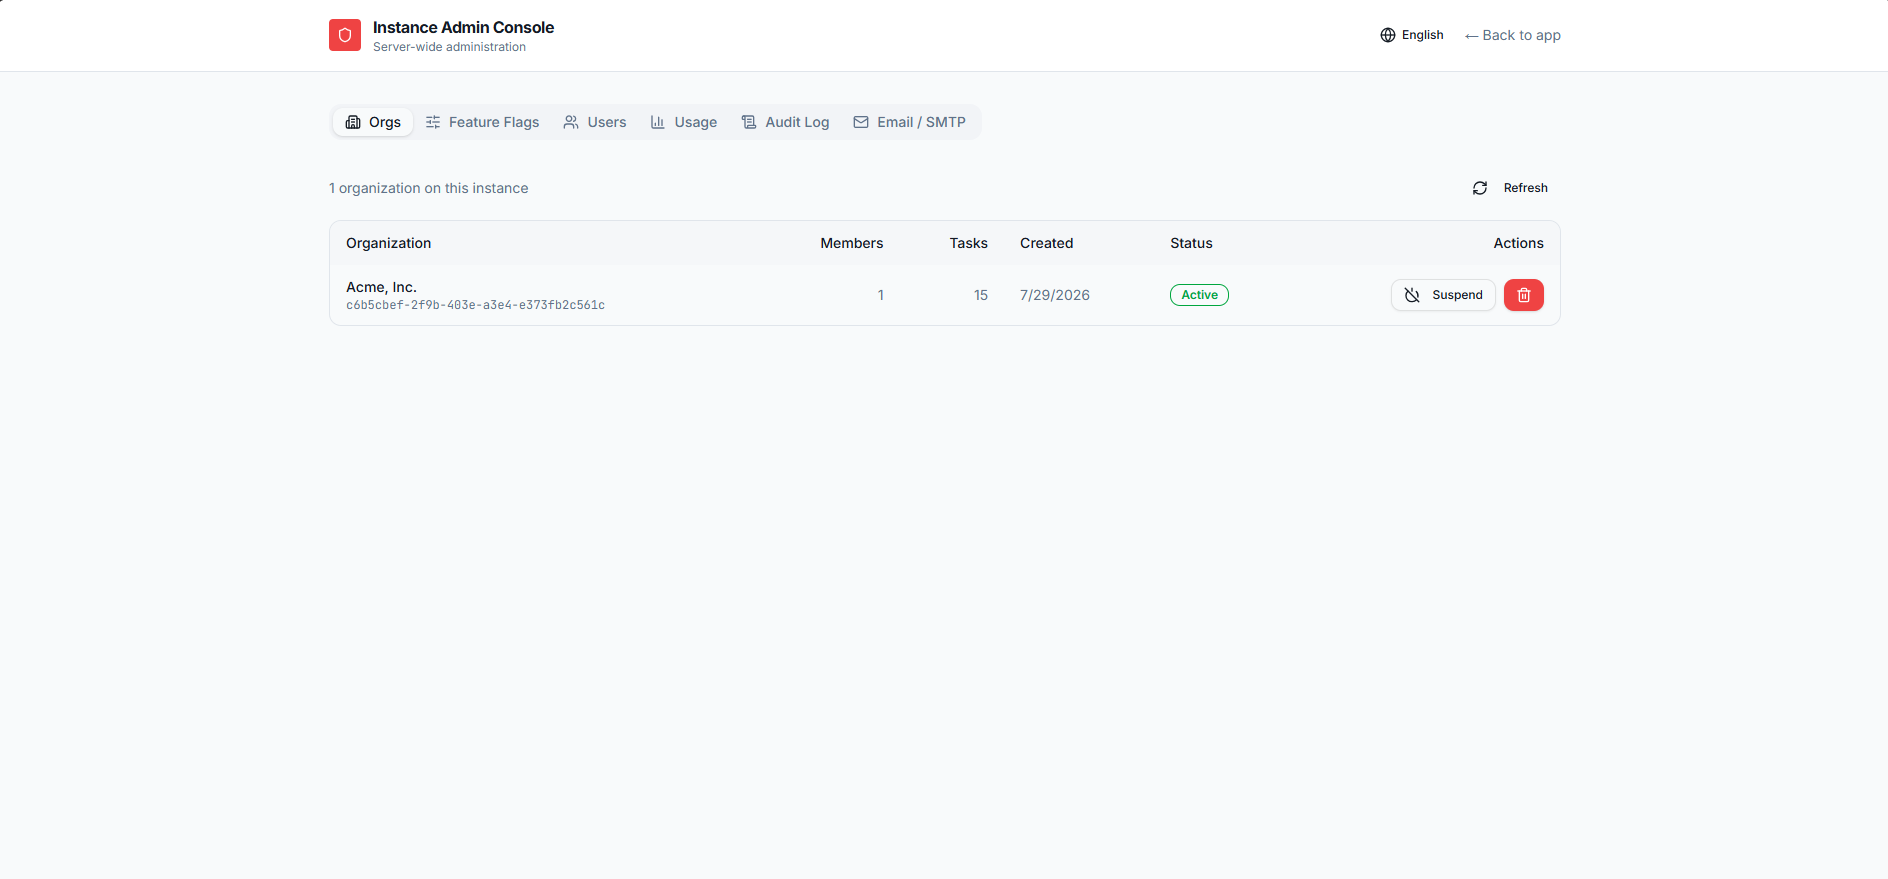
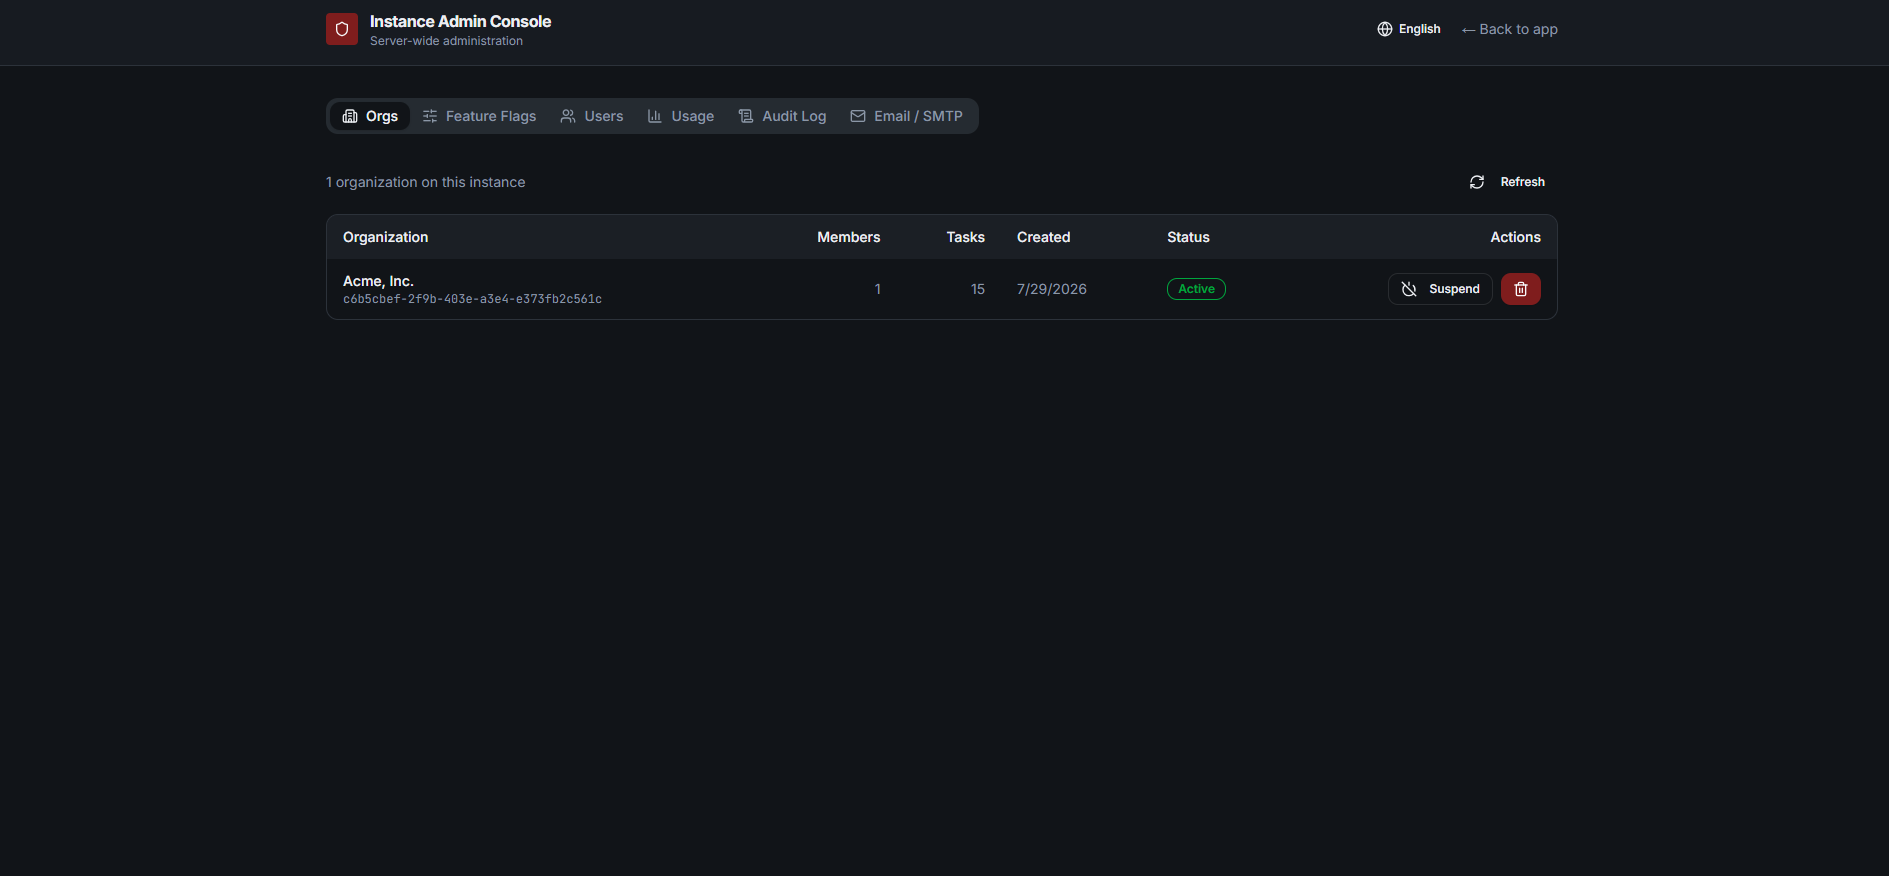
A single self-hosted install can host many organizations. The admin console sits above them all — a separate, server-wide surface for whoever runs the deployment. It opens on every org on the instance, each with its member and task counts, creation date, and a switch to suspend or remove it.

Opsly instance admin console on the Orgs tab, listing every organization on the server with member and task counts, creation date, an Active status, and suspend and delete actions Opsly instance admin console Orgs tab in dark mode, listing organizations with member and task counts, status and actions

Instance admin · Feature flags

Turn capabilities on and off per organization

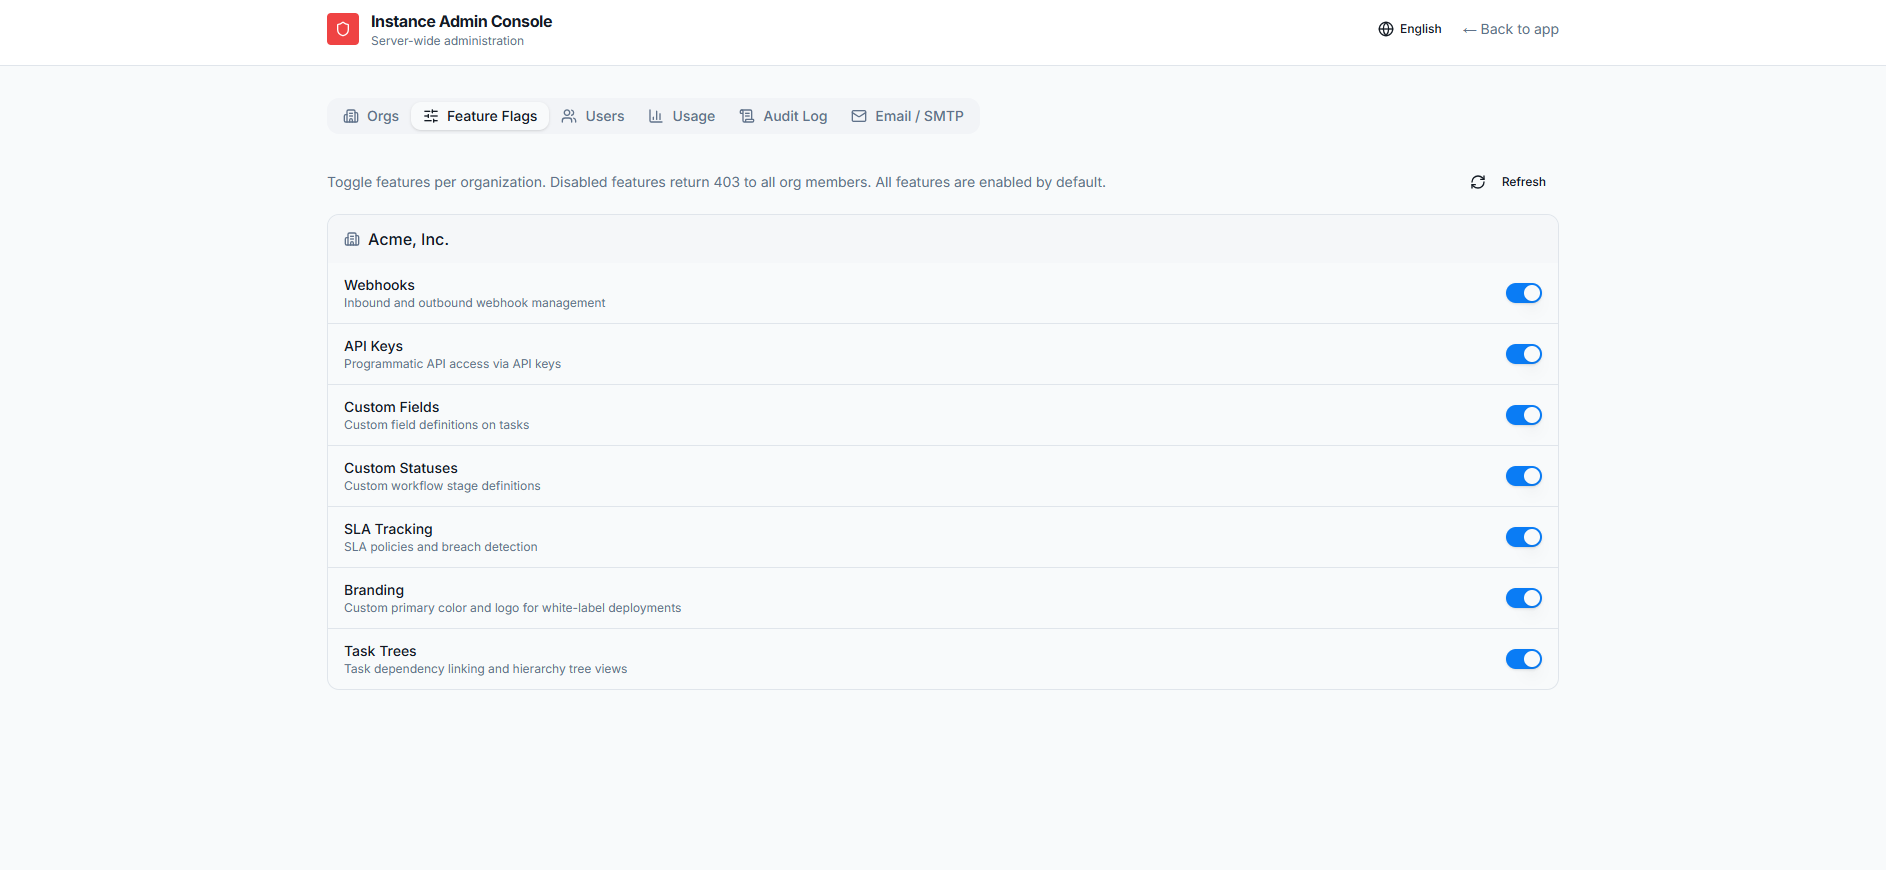
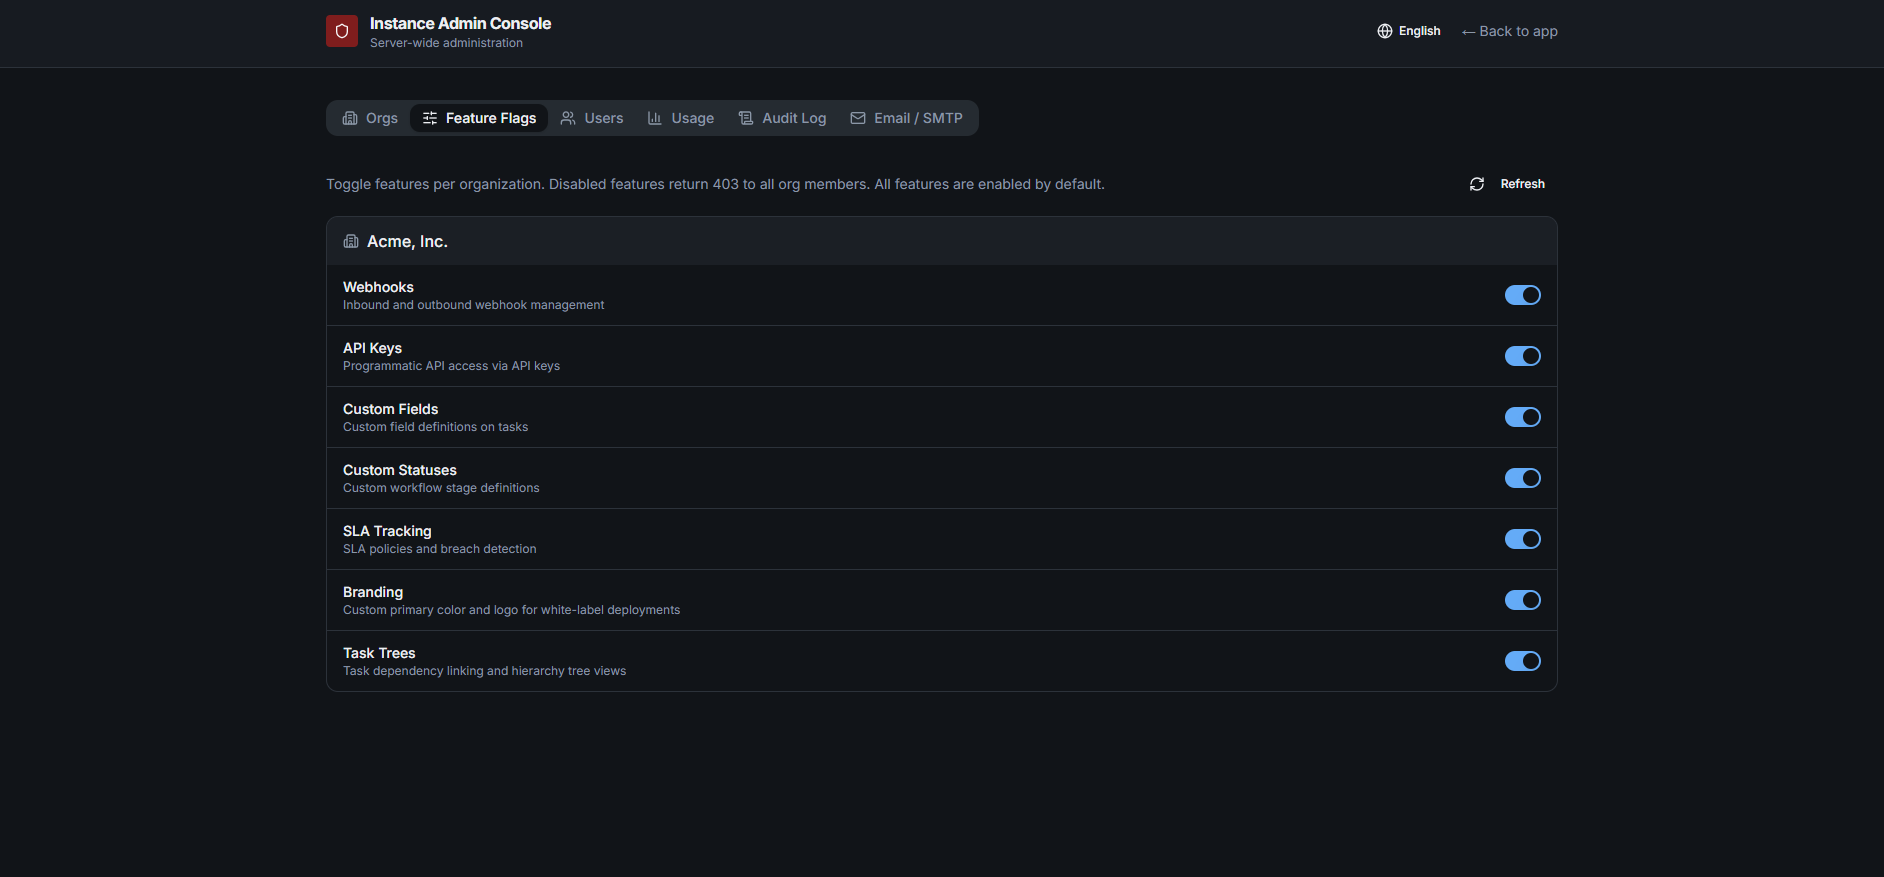
Flip features for each org independently — webhooks, API keys, custom fields, custom statuses, SLA tracking, branding, task trees. Everything is enabled by default; disable one and the API returns 403 to that org's members, no redeploy needed.

Opsly instance admin Feature Flags tab, showing per-organization toggles for webhooks, API keys, custom fields, custom statuses, SLA tracking, branding and task trees, all enabled Opsly instance admin Feature Flags tab in dark mode with per-organization capability toggles

Instance admin · Users

Every account, and where it belongs

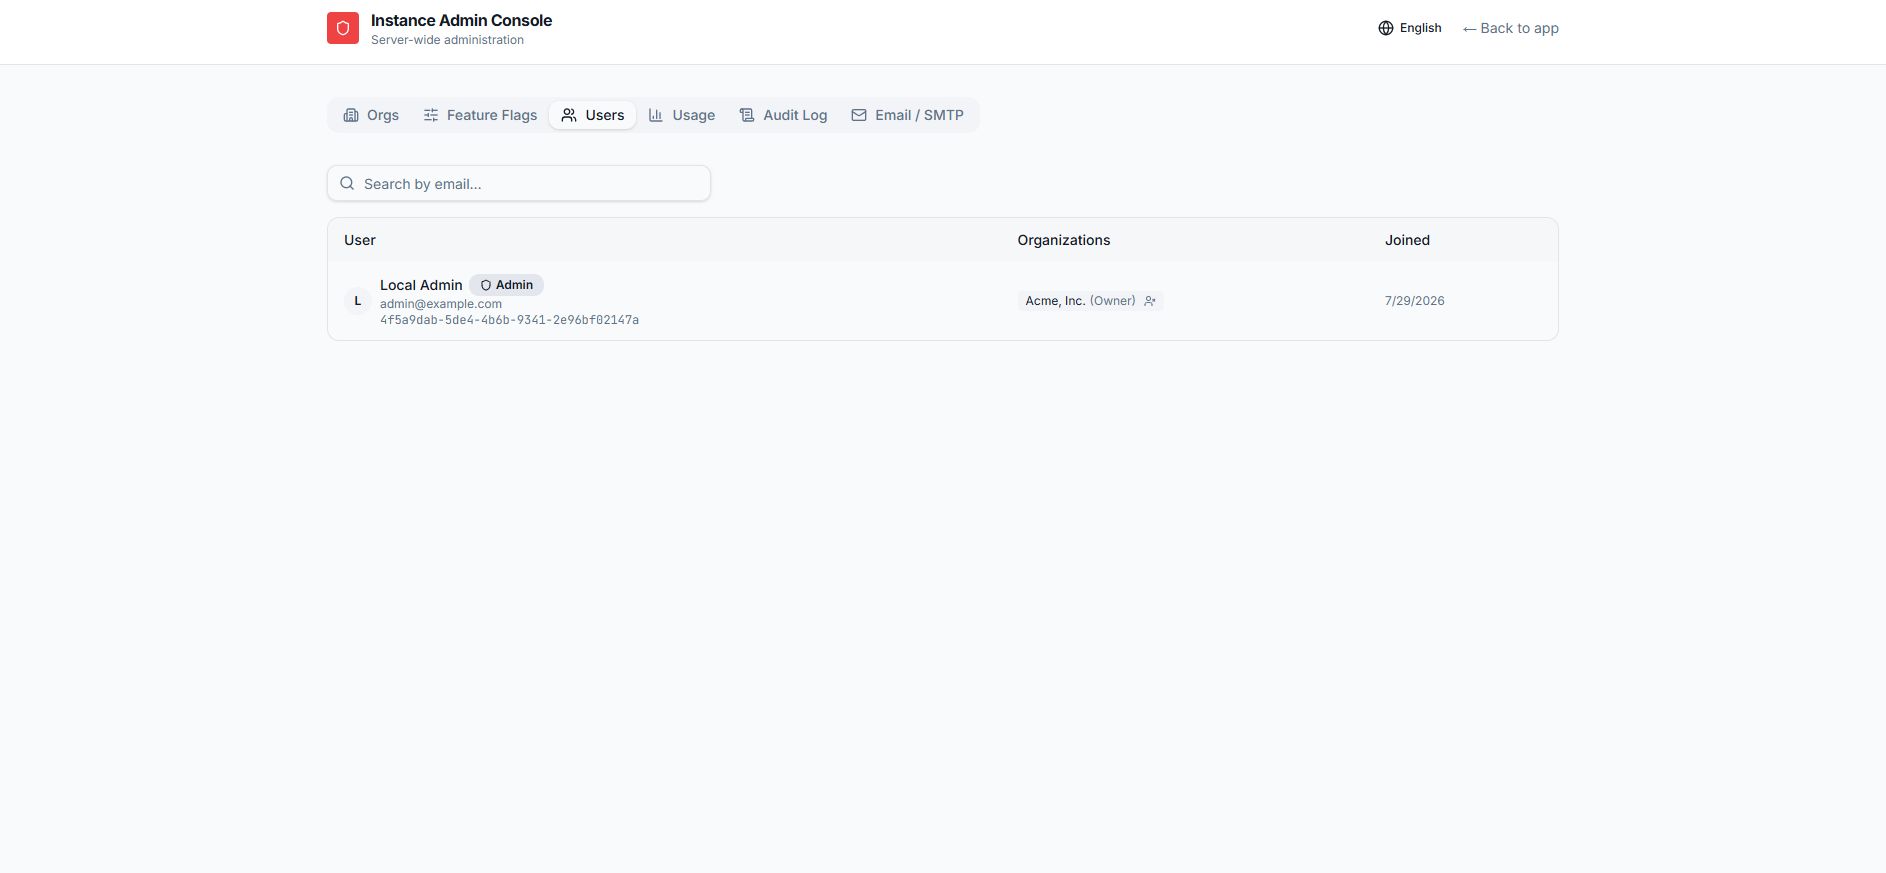
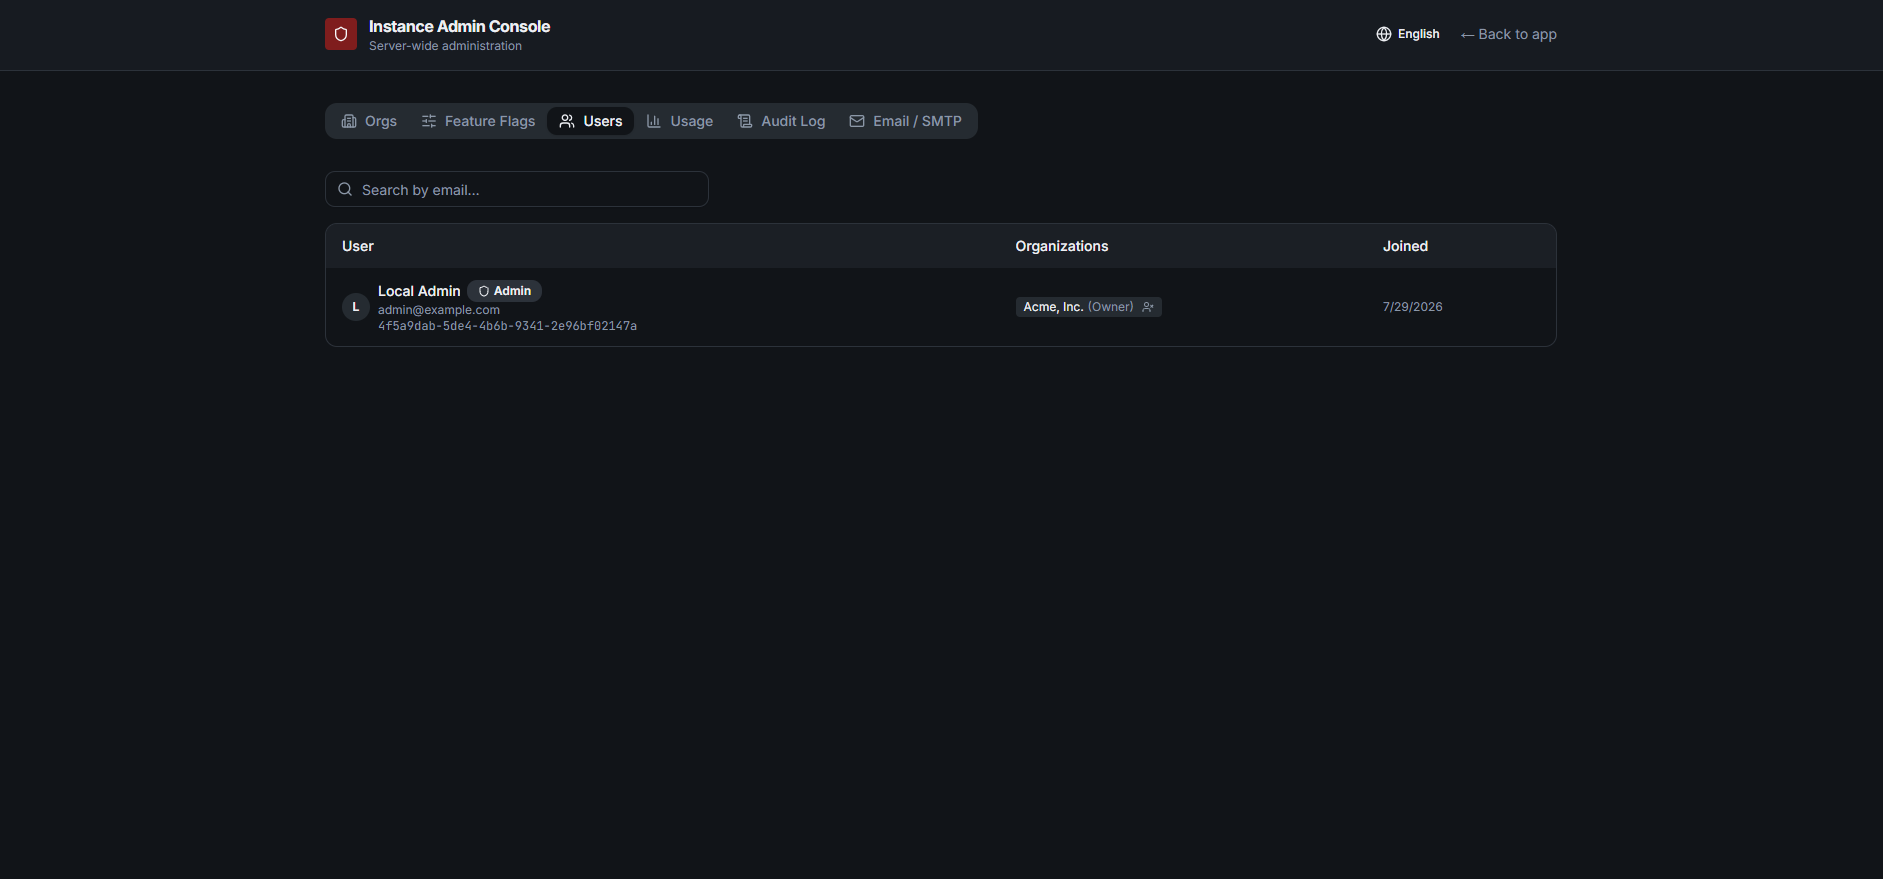
Search all users by email and see which organizations each belongs to and the role they hold, with instance-level admins flagged. One place to find who has access to what across the whole server.

Opsly instance admin Users tab with a search-by-email box and a table listing each user, their organizations and role, and the date they joined Opsly instance admin Users tab in dark mode listing users, their organizations and roles, and join dates

Instance admin · Usage

The whole instance at a glance

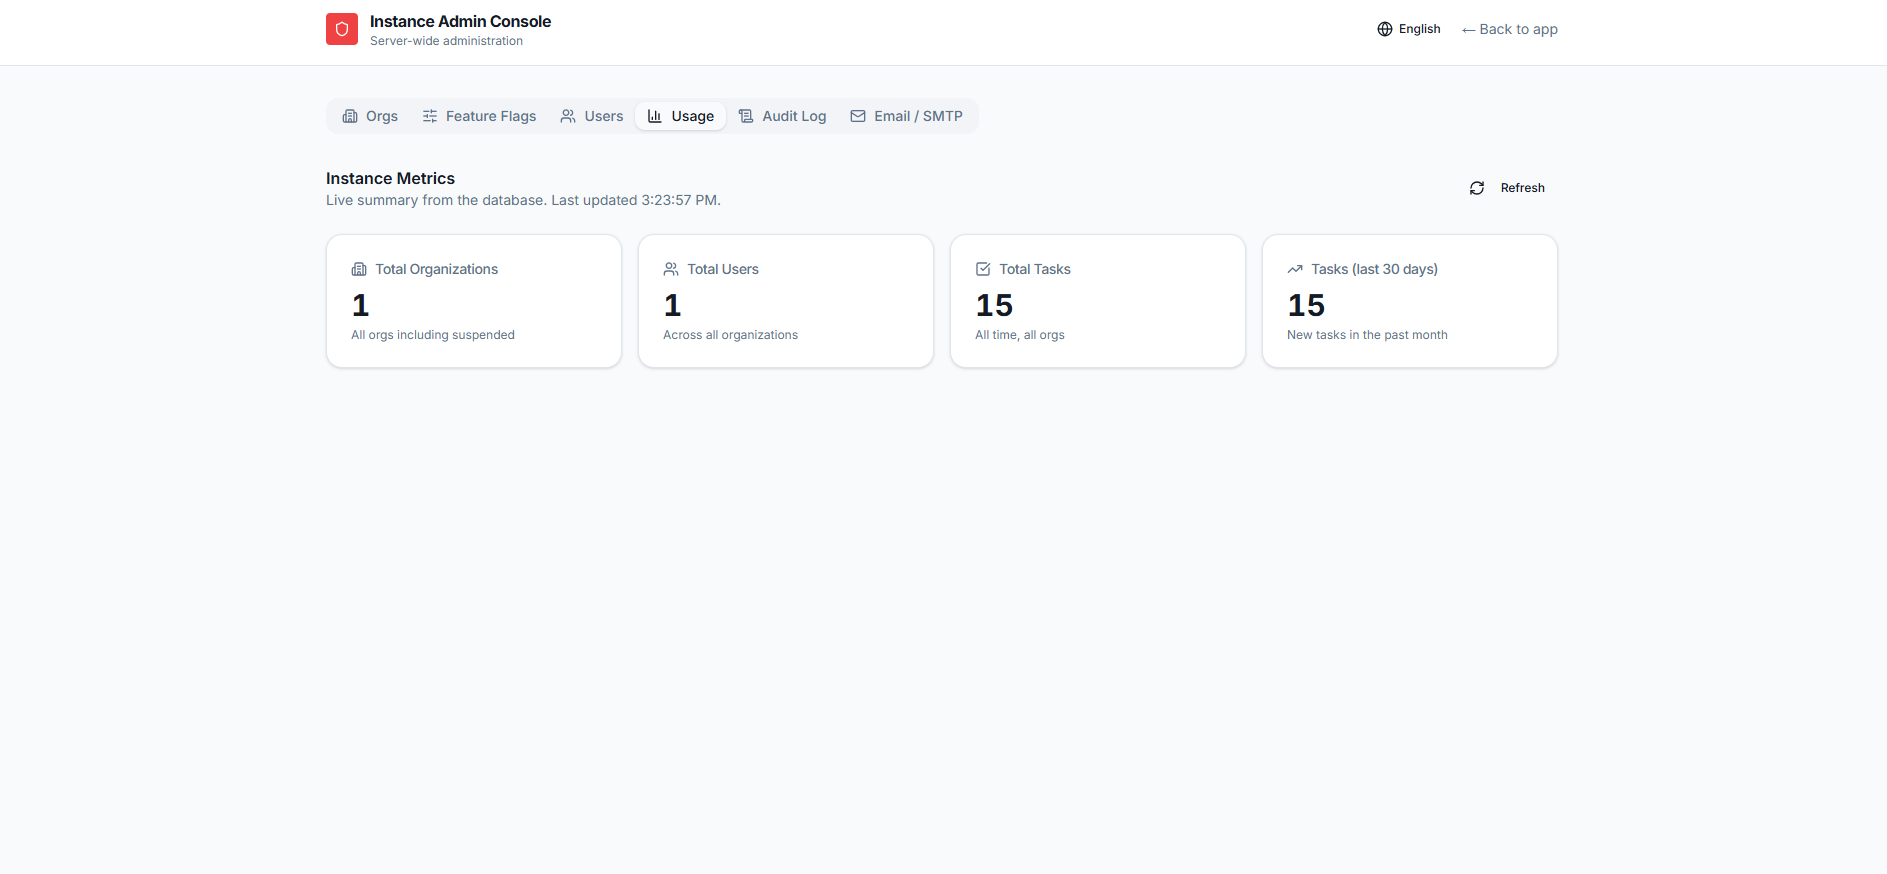
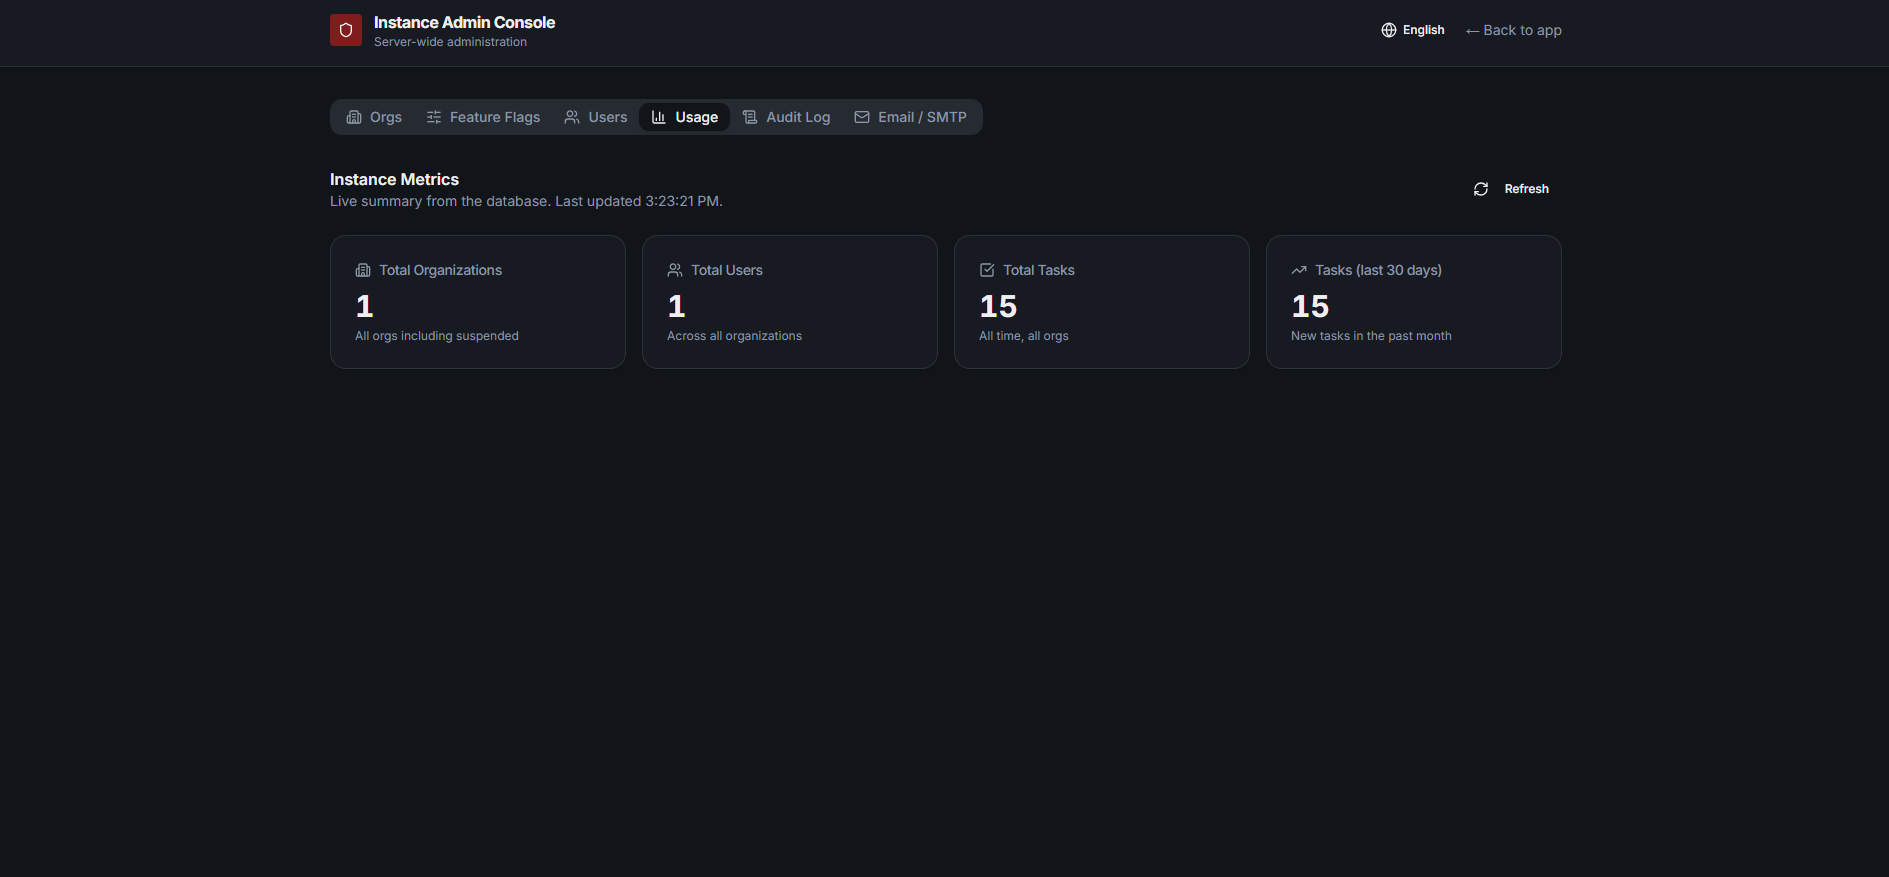
A live summary straight from the database: total organizations, users, and tasks across the entire deployment, plus how many tasks were created in the last thirty days.

Opsly instance admin Usage tab showing instance metrics cards for total organizations, total users, total tasks, and tasks created in the last 30 days Opsly instance admin Usage tab in dark mode with instance metric cards

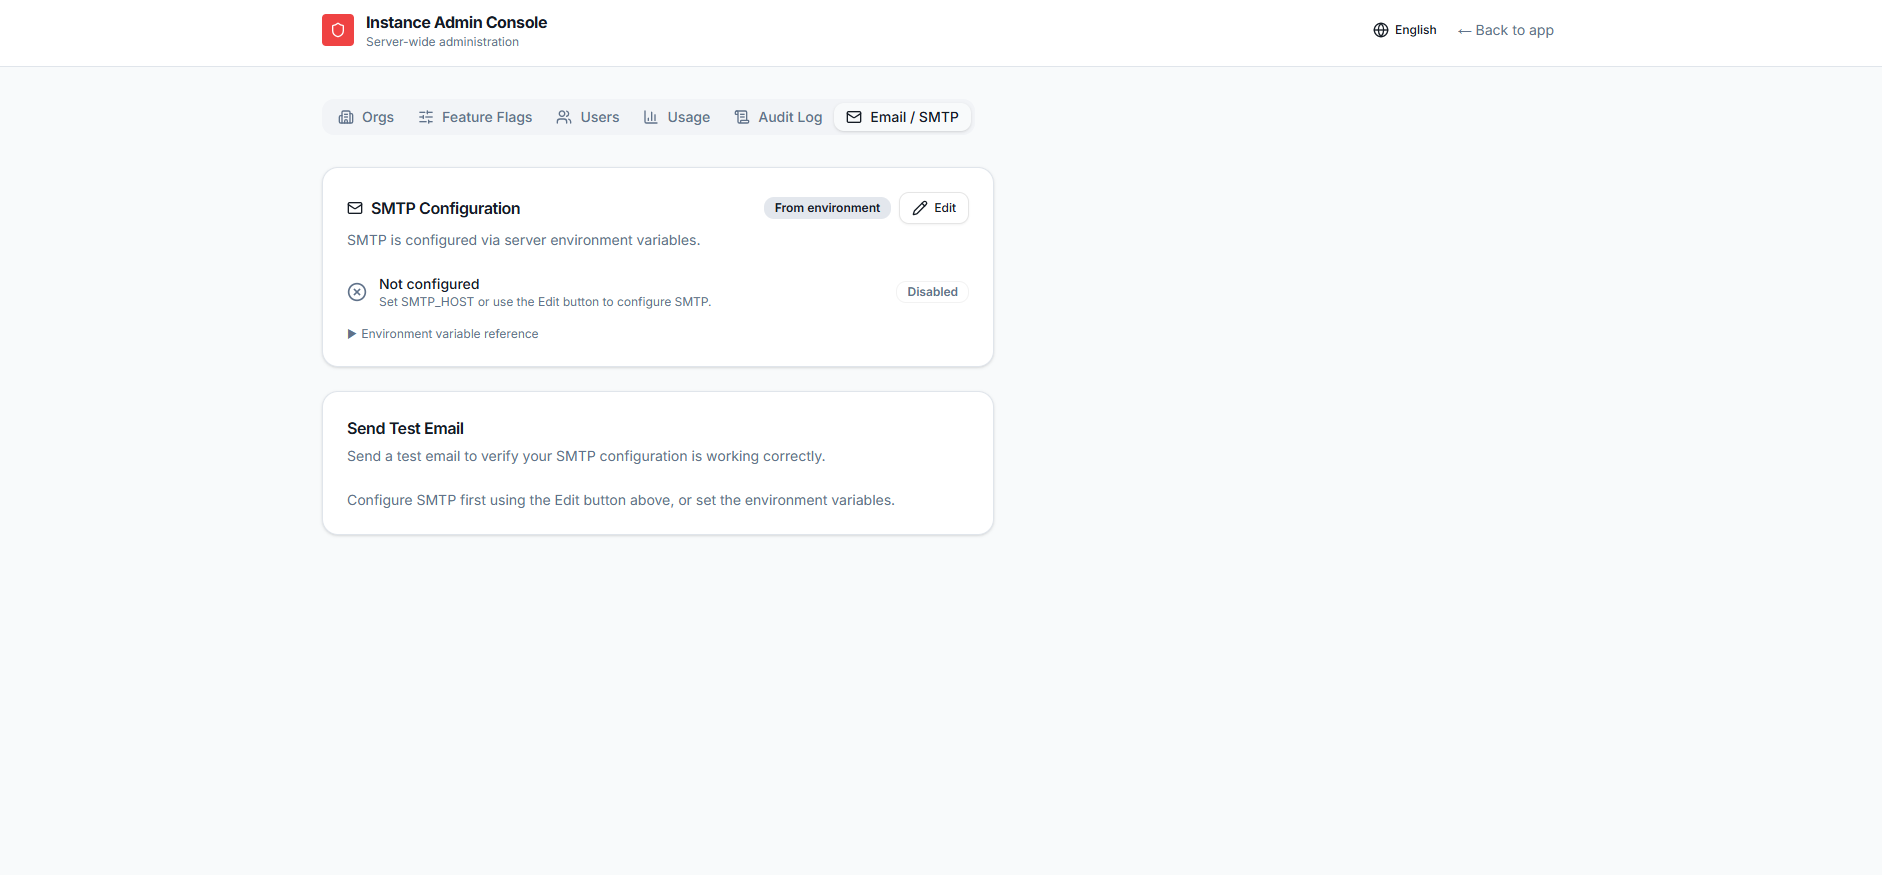
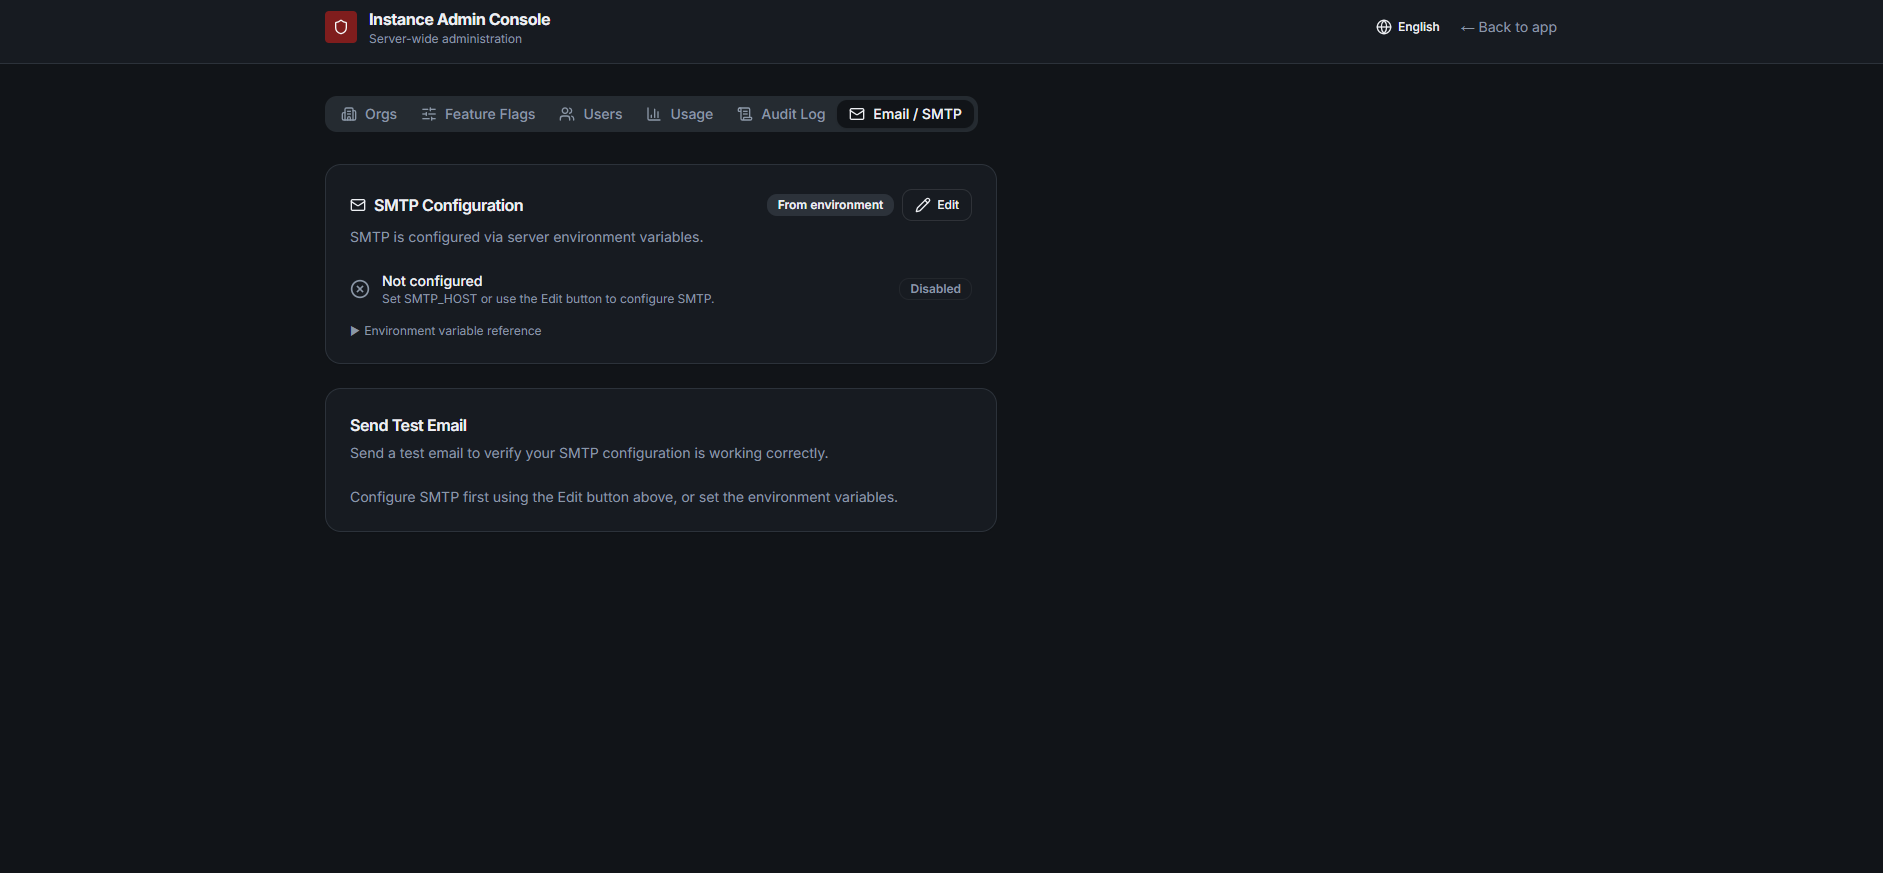
Instance admin · Email

Wire up mail, then send a test

Configure SMTP from the server's environment variables or edit it here, then fire a test email to confirm delivery before anything goes out. Invites and notifications all ride on this.

Opsly instance admin Email and SMTP tab with an SMTP configuration card sourced from the environment, a not-configured status, and a send test email panel Opsly instance admin Email and SMTP tab in dark mode with SMTP configuration and a send test email panel

Also in the box

The parts that don't photograph well

Plumbing you notice by its absence. All of it ships today on a self-hosted install.

Real-time updates

Notifications and cross-org changes stream over Server-Sent Events, so boards stay current without polling.

Offline-first

Edits queue locally while you're disconnected and sync automatically on reconnect, so nothing you do offline is lost.

Eight languages

English, Spanish, French, German, Portuguese, Japanese, Chinese, and Arabic, shipped in the box.

Scoped API keys

Machine credentials with granular permission scopes, so automation never borrows a human's login.

Webhooks

Inbound and outbound events to connect Opsly with your other systems.

Pluggable storage

Keep attachments on local disk or point Opsly at any S3-compatible bucket.

Your infrastructure

Run it where your data lives

One VPS with Docker Compose, or a distributed deployment. Your PostgreSQL, your backups, your retention policy.

local development, same shell session
# Node 24 (see .nvmrc)
pnpm install

# start Postgres, push schema, seed admin
docker compose -f docker-compose.local.yml up db -d
pnpm run setup

# api-server + frontend
pnpm run dev

Take it for a spin

Clone it, and you're running in about five commands

Everything above is free on your own install, under a license that converts to Apache 2.0 two years after each release (what source-available means). Or click around a working board first. Contributions welcome, issue first please.